SkiaSharp 是一个强大的跨平台 2D 图形库,提供了丰富的文本渲染功能。本文将详细介绍如何使用 SkiaSharp 进行文本渲染,并涵盖从基础到高级的各种技术。
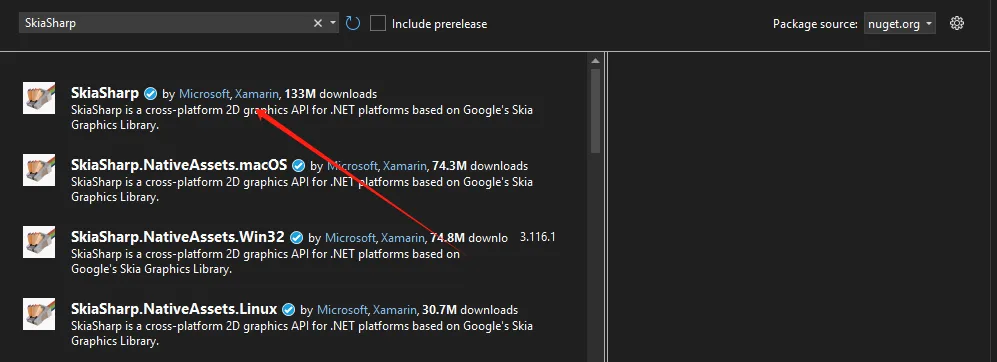
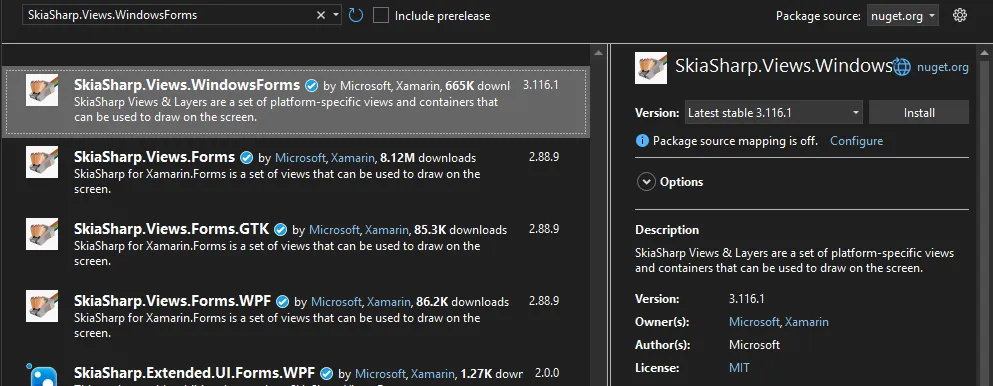
Nuget 安装包
C#SkiaSharp
SkiaSharp.Views.WindowsForms
基本文本渲染
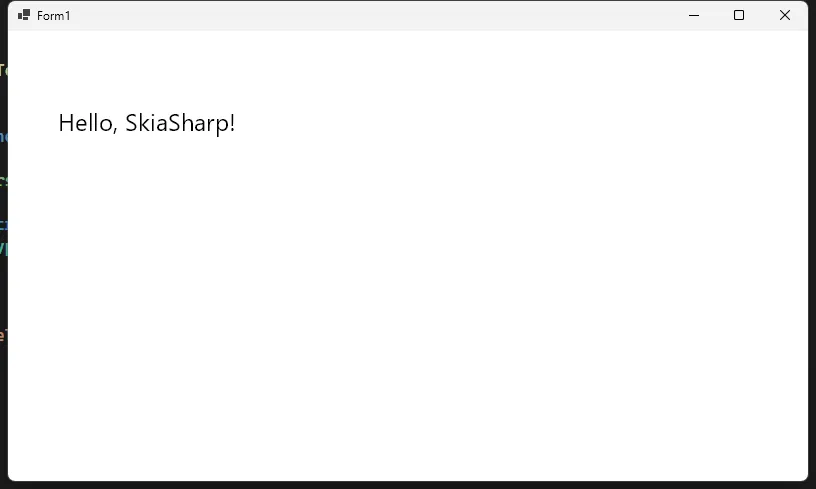
简单文本绘制
C#using SkiaSharp;
using SkiaSharp.Views.Desktop;

namespace AppFont
{
    public partial class Form1 : Form
    {
        private SKGLControl skControl;
        public Form1()
        {
            InitializeComponent();

            skControl=new SKGLControl();
            skControl.Dock=DockStyle.Fill;
            this.Controls.Add(skControl);

            skControl.PaintSurface += SkControl_PaintSurface;
        }

        private void SkControl_PaintSurface(object? sender, SKPaintGLSurfaceEventArgs e)
        {
            SKCanvas canvas = e.Surface.Canvas;
            canvas.Clear(SKColors.White);
            DrawSimpleText(canvas);
        }

        public void DrawSimpleText(SKCanvas canvas)
        {
            // 创建画笔
            using var paint = new SKPaint
            {
                Color = SKColors.Black,        // 文字颜色
                TextSize = 24,                 // 文字大小
                IsAntialias = true,            // 抗锯齿
                Typeface = SKTypeface.Default  // 默认字体
            };

            // 绘制文本
            canvas.DrawText("Hello, SkiaSharp!", 50, 100, paint);
        }
    }
}
C# Data Acquisition System in Action: Building High-Performance Real-Time Data Processing Pipeline from Scratch
In the modern Industry 4.0 era, data acquisition systems have become the core infrastructure for enterprise digital transformation. Whether it's sensor monitoring on factory production lines, IoT device status collection, or real-time transaction data processing in financial systems, an efficient and stable data acquisition system is crucial.
However, many C# developers often encounter these pain points when building such systems: high data processing latency, excessive memory usage, improper anomalous data handling, and lack of effective quality control mechanisms. This article will teach you how to build a professional-grade data acquisition system using C# through a complete practical case study, thoroughly solving these technical challenges.
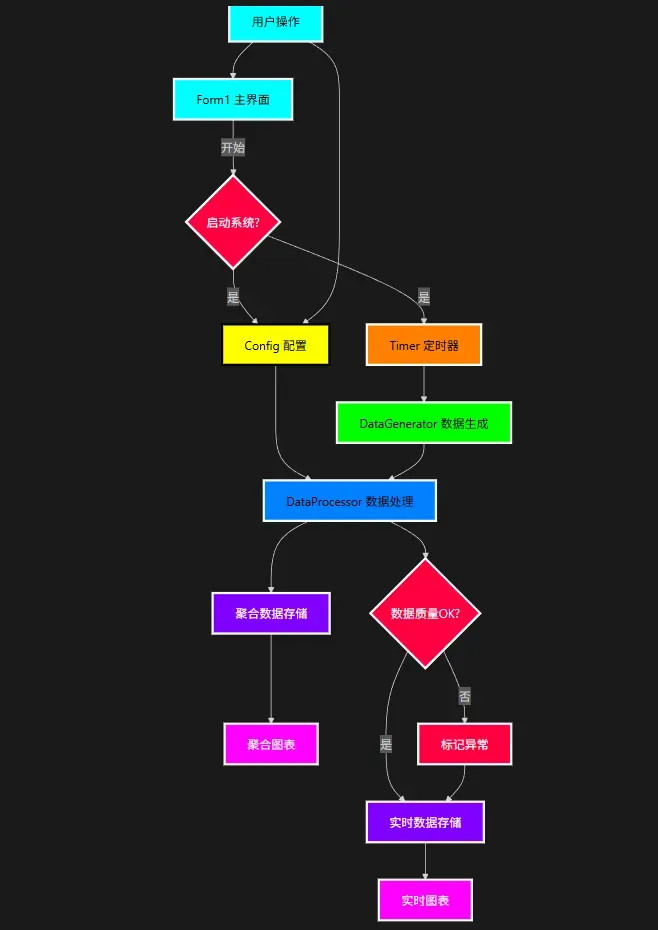
🎯 System Architecture Design: Three-Layer Data Pipeline
Core Architecture Concept
We adopt the Producer-Consumer Pattern combined with Channel asynchronous communication to build a three-layer data processing pipeline:
MarkdownData Generation Layer → Data Processing Layer → Data Aggregation Layer → UI Display Layer
The advantages of this design include:
- ✅ Strong Decoupling: Each layer has a single responsibility, making it easy to maintain and extend
- ✅ Excellent Performance: Channel-based asynchronous processing supporting high concurrency
- ✅ Fault Tolerance: Single-layer failures don't affect the entire system operation
在现代应用程序开发中,精美的视觉效果往往能提升用户体验。作为.NET平台上强大的跨平台2D图形绘图引擎,SkiaSharp提供了丰富的API来创建各种视觉效果。本文将聚焦于SkiaSharp中线条风格设计的艺术表现,通过详细的代码案例,帮助开发者掌握线宽、线帽和线段连接等关键技术,打造独具特色的视觉体验。
关键词:SkiaSharp教程、C#绘图、线条风格设计、.NET图形开发、跨平台UI、Xamarin绘图、MAUI绘图
SkiaSharp基础知识简介
SkiaSharp是Google's Skia图形库的.NET绑定,支持多平台(Windows、macOS、iOS、Android等)图形渲染。在开始线条艺术设计前,先了解几个核心概念:
C#// SkiaSharp核心组件
// SKCanvas: 画布,提供绘图表面
// SKPaint: 画笔,定义如何绘制(颜色、线宽、线帽等)
// SKPath: 路径,定义要绘制的几何形状
画笔属性详解:线条风格的关键
线宽(StrokeWidth)
线宽决定线条的粗细,单位为像素。
C#// 创建不同线宽的画笔
SKPaint thinPaint = new SKPaint
{
    Style = SKPaintStyle.Stroke,
    Color = SKColors.Blue,
    StrokeWidth = 2, // 细线
    IsAntialias = true // 抗锯齿,使线条更平滑
};

SKPaint mediumPaint = new SKPaint
{
    Style = SKPaintStyle.Stroke,
    Color = SKColors.Red,
    StrokeWidth = 8, // 中等线宽
    IsAntialias = true
};

SKPaint thickPaint = new SKPaint
{
    Style = SKPaintStyle.Stroke,
    Color = SKColors.Green,
    StrokeWidth = 16, // 粗线
    IsAntialias = true
};
线帽(StrokeCap)
线帽定义线条两端的形状,有三种基本类型:
C#// 线帽类型
SKPaint buttCapPaint = new SKPaint
{
    Style = SKPaintStyle.Stroke,
    Color = SKColors.DarkBlue,
    StrokeWidth = 12,
    StrokeCap = SKStrokeCap.Butt, // 平头线帽,线条在端点处切平
    IsAntialias = true
};

SKPaint roundCapPaint = new SKPaint
{
    Style = SKPaintStyle.Stroke,
    Color = SKColors.DarkRed,
    StrokeWidth = 12,
    StrokeCap = SKStrokeCap.Round, // 圆头线帽,线条两端为半圆形
    IsAntialias = true
};

SKPaint squareCapPaint = new SKPaint
{
    Style = SKPaintStyle.Stroke,
    Color = SKColors.DarkGreen,
    StrokeWidth = 12,
    StrokeCap = SKStrokeCap.Square, // 方头线帽,线条两端为矩形延伸
    IsAntialias = true
};
在SkiaSharp中,透明度(Alpha通道)控制是一个非常重要的特性,它可以让我们创建半透明效果,实现更丰富的视觉表现。本文将详细介绍如何在SkiaSharp中控制透明度。
Nuget 安装包
基础概念
在SkiaSharp中,颜色使用32位整数表示,包含四个通道:
- Alpha (透明度)
- Red (红色)
- Green (绿色)
- Blue (蓝色)
每个通道占用8位(0-255),其中:
- 0 表示完全透明
- 255 表示完全不透明
创建带透明度的颜色
使用SKColor构造函数
C#// 创建一个50%透明度的红色
// 参数顺序:red, green, blue, alpha
SKColor color1 = new SKColor(255, 0, 0, 128); // 红色,50%透明度

// 使用byte类型参数
byte alpha = 128;
byte red = 255;
byte green = 0;
byte blue = 0;
SKColor color2 = new SKColor(red, green, blue, alpha);
使用SKColors预定义颜色并调整透明度
C#// 从预定义颜色创建带透明度的颜色
SKColor transparentBlue = SKColors.Blue.WithAlpha(128);
使用SKColorF(浮点数表示)
C#// 使用浮点数表示颜色(范围0.0-1.0)
SKColorF colorF = new SKColorF(1.0f, 0.0f, 0.0f, 0.5f); // 红色,50%透明度
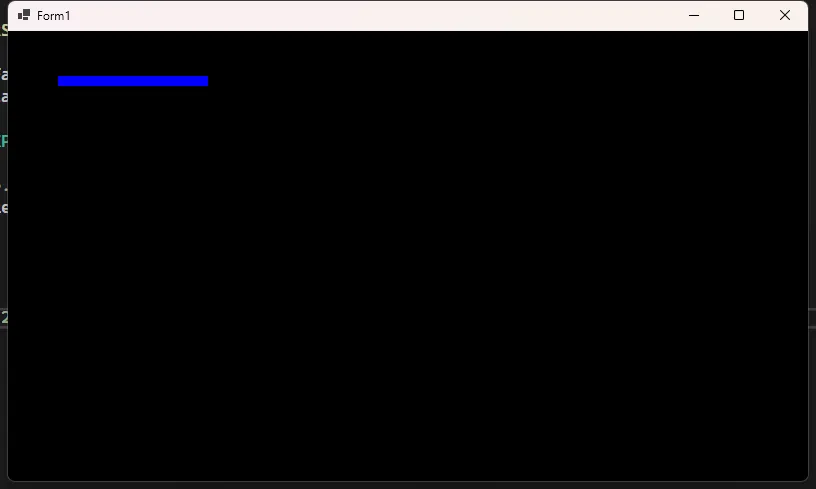
SkiaSharp 提供了丰富的画笔样式设置选项,通过 SKPaint 类可以控制绘制线条的各种属性。本文将详细介绍线宽(StrokeWidth)、线帽(StrokeCap)和线段连接(StrokeJoin)的使用方法。
Nuget 安装包
线宽 (StrokeWidth)
线宽决定了绘制线条的粗细,通过设置 SKPaint.StrokeWidth 属性来控制。
C#public partial class Form1 : Form
{
    SKGLControl skControl;
    public Form1()
    {
        InitializeComponent();

        skControl = new SKGLControl();
        skControl.Dock = DockStyle.Fill;
        skControl.PaintSurface += SkControl_PaintSurface;

        this.Controls.Add(skControl);
        this.BackColor = System.Drawing.Color.Black;
    }

    private void SkControl_PaintSurface(object sender, SKPaintGLSurfaceEventArgs e)
    {
        SKCanvas canvas = e.Surface.Canvas;
        canvas.Clear(SKColors.Black);
        // 创建画笔对象
        using var paint = new SKPaint
        {
            Style = SKPaintStyle.Stroke,    // 设置为描边模式
            Color = SKColors.Blue,          // 设置颜色
            StrokeWidth = 10                // 设置线宽为10像素
        };

        // 使用画笔绘制一条直线
        canvas.DrawLine(50, 50, 200, 50, paint);
    }

}