
Press Ctrl+ and K to search
目录
项目中需要实时监控设备状态,传统的Chart控件性能不够,WinForms又要求高颜值界面?本文教你用ScottPlot 5.0 + Lightning.NET构建一个完整的工业监控系统,1000个数据点丝滑滚动,再也不用担心界面卡顿!
🎯 为什么选择Lightning.NET?
- 嵌入式数据库,无需安装SQL Server
- LMDB引擎,读写性能极佳
- 零配置,打包即可部署
🎯 痛点分析:为什么选择ScottPlot 5.0?
传统方案的局限性
大多数C#开发者在做数据可视化时,会首选微软自带的Chart控件。但在工业监控场景下,这个"老古董"很快就暴露出致命问题:
- 性能瓶颈:超过500个数据点就开始卡顿
- 界面老土:2000年代的审美,客户直接说"太丑"
- 功能受限:缺乏实时滚动、动态缩放等现代化交互
ScottPlot 5.0的优势
ScottPlot作为.NET生态中的"后起之秀",在5.0版本中进行了架构重构:
- 🚀 高性能渲染:轻松处理万级数据点
- 🎨 现代化UI:开箱即用的专业外观
- 📊 丰富图表类型:从基础折线图到复杂热力图
- ⚡ 实时更新:专为动态数据设计的API
🔧 技术选型:构建完整解决方案
核心技术栈
C#// 项目依赖包
<PackageReference Include="ScottPlot.WinForms" Version="5.0.21" />
<PackageReference Include="Lightning.NET" Version="0.15.1" />
<PackageReference Include="System.Text.Json" Version="8.0.0" />
💻 代码实战:核心功能实现
🏗️ 数据模型设计
C#public class SensorData
{
    public int EquipmentId { get; set; }      // 设备ID
    public long Timestamp { get; set; }       // Unix时间戳
    public double Temperature { get; set; }   // 温度
    public double Pressure { get; set; }      // 压力
    public double Vibration { get; set; }     // 振动
    public double Speed { get; set; }         // 转速
    public string Status { get; set; }        // 设备状态
}
🎯 关键实现:动态数据滚动
这是最核心的功能,很多开发者在这里踩坑。ScottPlot 5.0不支持直接替换数据,正确的方式是:
C#private void UpdateCharts()
{
    if (_timeData.Count == 0) return;

    var timeArray = _timeData.ToArray();
    var tempArray = _temperatureData.ToArray();

    // ⚠️ 关键:移除旧图表,创建新图表
    scottPlotTemperature.Plot.Remove(_temperatureScatter);
    _temperatureScatter = scottPlotTemperature.Plot.Add.Scatter(timeArray, tempArray);
    _temperatureScatter.Color = ScottPlot.Color.FromHex("#FF0000");
    _temperatureScatter.LineWidth = 2;
    _temperatureScatter.MarkerSize = 0; // 只显示线条

    // 动态调整X轴时间窗口
    if (timeArray.Length > 0)
    {
        var latestTime = timeArray.Last();
        var windowMinutes = 10; // 显示最近10分钟
        var earliestTime = latestTime - (windowMinutes / (24.0 * 60.0));

        scottPlotTemperature.Plot.Axes.SetLimitsX(earliestTime, latestTime);
    }

    scottPlotTemperature.Refresh();
}
💡 核心技巧:
- 使用
DateTime.ToOADate()确保时间轴正确显示 - 控制数据点数量(建议1000个以内)
- 设置合理的刷新频率(200ms)
📊 时间轴处理:显示真实时间
C#private void AddDataPoint(long timestamp, double temperature, double pressure, double vibration)
{
    // 转换为ScottPlot支持的时间格式
    var oaDate = DateTimeOffset.FromUnixTimeSeconds(timestamp).DateTime.ToOADate();

    _timeData.Add(oaDate);
    _temperatureData.Add(temperature);
    _pressureData.Add(pressure);
    _vibrationData.Add(vibration);

    // 保持滚动窗口,移除最旧数据
    while (_timeData.Count > MaxDataPoints)
    {
        _timeData.RemoveAt(0);
        _temperatureData.RemoveAt(0);
        _pressureData.RemoveAt(0);
        _vibrationData.RemoveAt(0);
    }
}
🎨 界面美化:专业级外观设置
C#private void InitializeTemperatureChart()
{
    // 设置中文字体
    scottPlotTemperature.Plot.Axes.Left.Label.FontName = "Microsoft YaHei";
    scottPlotTemperature.Plot.Axes.Bottom.Label.FontName = "Microsoft YaHei";

    // 现代化配色方案
    scottPlotTemperature.Plot.Grid.MajorLineColor = ScottPlot.Color.FromHex("#32000000");
    scottPlotTemperature.Plot.FigureBackground.Color = ScottPlot.Color.FromHex("#FFFFFF");
    scottPlotTemperature.Plot.DataBackground.Color = ScottPlot.Color.FromHex("#F5F5F5");

    // 设置时间轴格式
    scottPlotTemperature.Plot.Axes.DateTimeTicksBottom();

    // 添加警戒线
    var warningLine = scottPlotTemperature.Plot.Add.HorizontalLine(70);
    warningLine.Color = ScottPlot.Color.FromHex("#FFA500");
    warningLine.LinePattern = ScottPlot.LinePattern.Dashed;
}
完整代码
C#using AppLightningDbMonitor;
using LightningDB;
using ScottPlot;
using ScottPlot.Plottables;
using System;
using System.Collections.Generic;
using System.Drawing;
using System.Globalization;
using System.Linq;
using System.Text;
using System.Text.Json;
using System.Threading;
using System.Threading.Tasks;
using System.Windows.Forms;
using Timer = System.Windows.Forms.Timer;
namespace AppLightningDbMonitor
{
public partial class FrmMain : Form
{
private readonly DataService _dataService;
private readonly Timer _dataCollectionTimer;
private readonly Timer _chartUpdateTimer;
private readonly Random _random;
// 数据管理 - 使用数组来存储数据
private readonly List<double> _temperatureData = new();
private readonly List<double> _pressureData = new();
private readonly List<double> _vibrationData = new();
private readonly List<double> _timeData = new();
private Scatter _temperatureScatter;
private Scatter _pressureScatter;
private Scatter _vibrationScatter;
private readonly int MaxDataPoints = 1000; // 最大显示点数
public FrmMain()
{
InitializeComponent();
// 设置中文支持
Thread.CurrentThread.CurrentUICulture = new CultureInfo("zh-CN");
_dataService = new DataService("./industrial_data");
_random = new Random();
// 设置定时器
_dataCollectionTimer = new Timer();
_dataCollectionTimer.Interval = 1000; // 1秒采集一次数据
_dataCollectionTimer.Tick += DataCollectionTimer_Tick;
_chartUpdateTimer = new Timer();
_chartUpdateTimer.Interval = 200; // 200毫秒更新一次图表
_chartUpdateTimer.Tick += ChartUpdateTimer_Tick;
InitializeCharts();
LoadEquipmentList();
InitializeRealTimeDisplay();
}
private void InitializeCharts()
{
// 配置温度图表
InitializeTemperatureChart();
// 配置压力图表
InitializePressureChart();
// 配置振动图表
InitializeVibrationChart();
}
private void InitializeTemperatureChart()
{
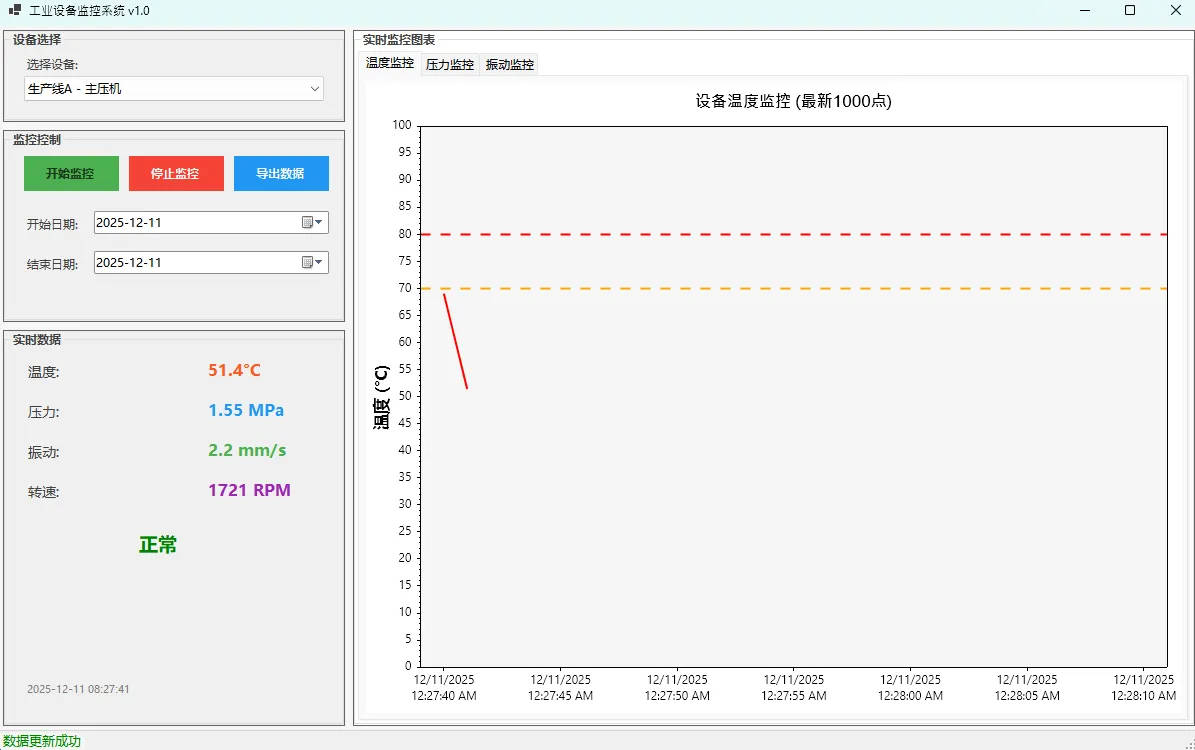
scottPlotTemperature.Plot.Title("设备温度监控 (最新1000点)");
scottPlotTemperature.Plot.Font.Automatic();
scottPlotTemperature.Plot.Axes.Left.Label.FontName = "Microsoft YaHei";
scottPlotTemperature.Plot.Axes.Bottom.Label.FontName = "Microsoft YaHei";
scottPlotTemperature.Plot.XLabel("时间");
scottPlotTemperature.Plot.YLabel("温度 (°C)");
scottPlotTemperature.Plot.Grid.MajorLineColor = ScottPlot.Color.FromHex("#32000000");
scottPlotTemperature.Plot.FigureBackground.Color = ScottPlot.Color.FromHex("#FFFFFF");
scottPlotTemperature.Plot.DataBackground.Color = ScottPlot.Color.FromHex("#F5F5F5");
scottPlotTemperature.Plot.Axes.DateTimeTicksBottom();
// 初始创建空的散点图 - 温度
_temperatureScatter = scottPlotTemperature.Plot.Add.Scatter(new double[0], new double[0]);
_temperatureScatter.Color = ScottPlot.Color.FromHex("#FF0000");
_temperatureScatter.LineWidth = 2;
_temperatureScatter.MarkerSize = 0;
// 添加警戒线
var tempWarningLine = scottPlotTemperature.Plot.Add.HorizontalLine(70);
tempWarningLine.Color = ScottPlot.Color.FromHex("#FFA500");
tempWarningLine.LineWidth = 2;
tempWarningLine.LinePattern = ScottPlot.LinePattern.Dashed;
var tempCriticalLine = scottPlotTemperature.Plot.Add.HorizontalLine(80);
tempCriticalLine.Color = ScottPlot.Color.FromHex("#FF0000");
tempCriticalLine.LineWidth = 2;
tempCriticalLine.LinePattern = ScottPlot.LinePattern.Dashed;
scottPlotTemperature.Plot.Axes.SetLimitsY(0, 100);
}
private void InitializePressureChart()
{
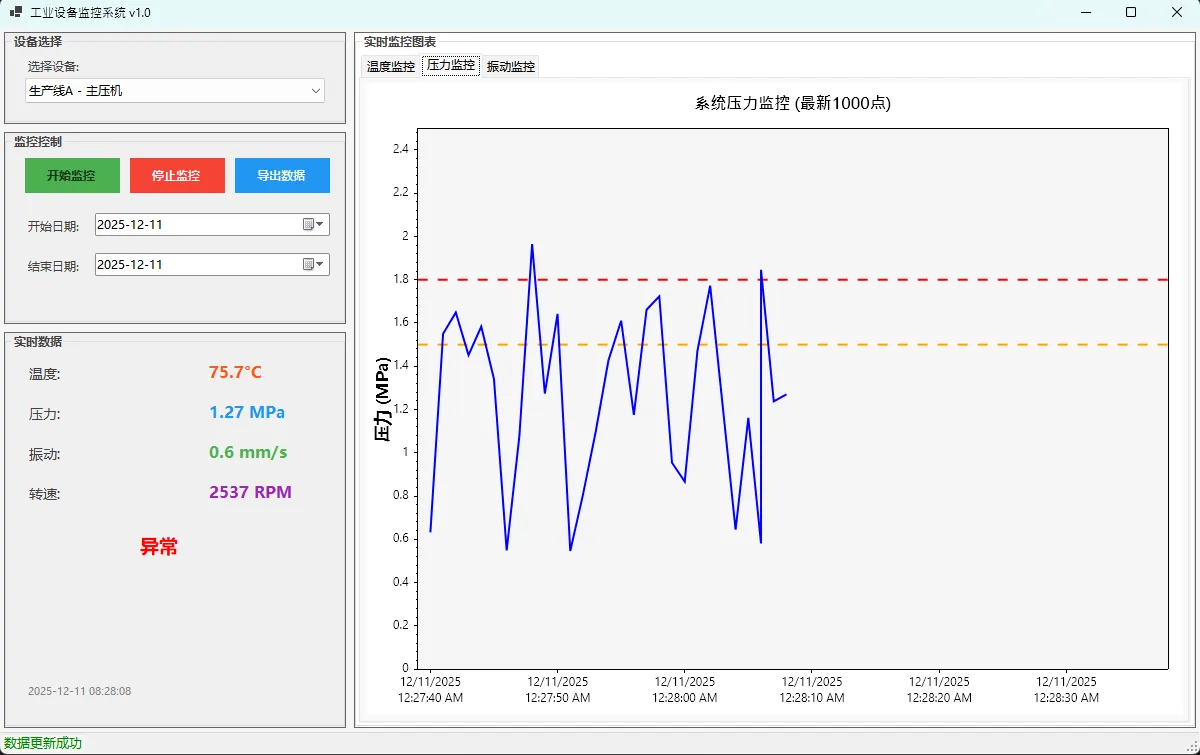
scottPlotPressure.Plot.Title("系统压力监控 (最新1000点)");
scottPlotPressure.Plot.Font.Automatic();
scottPlotPressure.Plot.Axes.Left.Label.FontName = "Microsoft YaHei";
scottPlotPressure.Plot.Axes.Bottom.Label.FontName = "Microsoft YaHei";
scottPlotPressure.Plot.XLabel("时间");
scottPlotPressure.Plot.YLabel("压力 (MPa)");
scottPlotPressure.Plot.Grid.MajorLineColor = ScottPlot.Color.FromHex("#32000000");
scottPlotPressure.Plot.FigureBackground.Color = ScottPlot.Color.FromHex("#FFFFFF");
scottPlotPressure.Plot.DataBackground.Color = ScottPlot.Color.FromHex("#F5F5F5");
// 设置DateTime轴格式
scottPlotPressure.Plot.Axes.DateTimeTicksBottom();
// 初始创建空的散点图 - 压力
_pressureScatter = scottPlotPressure.Plot.Add.Scatter(new double[0], new double[0]);
_pressureScatter.Color = ScottPlot.Color.FromHex("#0000FF");
_pressureScatter.LineWidth = 2;
_pressureScatter.MarkerSize = 0;
// 添加警戒线
var pressureWarningLine = scottPlotPressure.Plot.Add.HorizontalLine(1.5);
pressureWarningLine.Color = ScottPlot.Color.FromHex("#FFA500");
pressureWarningLine.LineWidth = 2;
pressureWarningLine.LinePattern = ScottPlot.LinePattern.Dashed;
var pressureCriticalLine = scottPlotPressure.Plot.Add.HorizontalLine(1.8);
pressureCriticalLine.Color = ScottPlot.Color.FromHex("#FF0000");
pressureCriticalLine.LineWidth = 2;
pressureCriticalLine.LinePattern = ScottPlot.LinePattern.Dashed;
scottPlotPressure.Plot.Axes.SetLimitsY(0, 2.5);
}
private void InitializeVibrationChart()
{
scottPlotVibration.Plot.Title("设备振动监控 (最新1000点)");
scottPlotVibration.Plot.Font.Automatic();
scottPlotVibration.Plot.Axes.Left.Label.FontName = "Microsoft YaHei";
scottPlotVibration.Plot.Axes.Bottom.Label.FontName = "Microsoft YaHei";
scottPlotVibration.Plot.XLabel("时间");
scottPlotVibration.Plot.YLabel("振动幅度 (mm/s)");
scottPlotVibration.Plot.Grid.MajorLineColor = ScottPlot.Color.FromHex("#32000000");
scottPlotVibration.Plot.FigureBackground.Color = ScottPlot.Color.FromHex("#FFFFFF");
scottPlotVibration.Plot.DataBackground.Color = ScottPlot.Color.FromHex("#F5F5F5");
scottPlotVibration.Plot.Axes.DateTimeTicksBottom();
// 初始创建空的散点图 - 振动
_vibrationScatter = scottPlotVibration.Plot.Add.Scatter(new double[0], new double[0]);
_vibrationScatter.Color = ScottPlot.Color.FromHex("#008000");
_vibrationScatter.LineWidth = 2;
_vibrationScatter.MarkerSize = 0;
// 添加警戒线
var vibrationWarningLine = scottPlotVibration.Plot.Add.HorizontalLine(3);
vibrationWarningLine.Color = ScottPlot.Color.FromHex("#FFA500");
vibrationWarningLine.LineWidth = 2;
vibrationWarningLine.LinePattern = ScottPlot.LinePattern.Dashed;
var vibrationCriticalLine = scottPlotVibration.Plot.Add.HorizontalLine(4);
vibrationCriticalLine.Color = ScottPlot.Color.FromHex("#FF0000");
vibrationCriticalLine.LineWidth = 2;
vibrationCriticalLine.LinePattern = ScottPlot.LinePattern.Dashed;
// 设置Y轴范围
scottPlotVibration.Plot.Axes.SetLimitsY(0, 6);
}
private void LoadEquipmentList()
{
cmbEquipment.Items.AddRange(new string[]
{
"生产线A - 主压机",
"生产线B - 辅助泵站",
"生产线C - 冷却系统",
"质检区 - 检测设备",
"包装区 - 封装机"
});
cmbEquipment.SelectedIndex = 0;
}
private void InitializeRealTimeDisplay()
{
// 初始化实时数据显示
UpdateRealTimeData();
}
private async void DataCollectionTimer_Tick(object sender, EventArgs e)
{
await CollectAndSaveData();
}
private async Task CollectAndSaveData()
{
try
{
var equipmentId = cmbEquipment.SelectedIndex + 1;
var timestamp = DateTimeOffset.UtcNow.ToUnixTimeSeconds();
// 模拟传感器数据
var temperature = 20 + _random.NextDouble() * 60; // 20-80°C
var pressure = 0.5 + _random.NextDouble() * 1.5; // 0.5-2.0 MPa
var vibration = _random.NextDouble() * 5; // 0-5 mm/s
var speed = 1000 + _random.NextDouble() * 2000; // 1000-3000 RPM
var sensorData = new SensorData
{
EquipmentId = equipmentId,
Timestamp = timestamp,
Temperature = temperature,
Pressure = pressure,
Vibration = vibration,
Speed = speed,
Status = temperature > 70 || pressure > 1.8 || vibration > 4 ? "异常" : "正常"
};
// 保存到数据库
await Task.Run(() => _dataService.SaveSensorData(sensorData));
// 添加数据到列表中
if (equipmentId == cmbEquipment.SelectedIndex + 1)
{
AddDataPoint(timestamp, temperature, pressure, vibration);
}
// 更新实时显示
Invoke(new Action(UpdateRealTimeData));
}
catch (Exception ex)
{
lblStatus.Text = $"数据采集失败: {ex.Message}";
lblStatus.ForeColor = System.Drawing.Color.Red;
}
}
private void AddDataPoint(long timestamp, double temperature, double pressure, double vibration)
{
// 转换为OADate格式用于DateTime轴
var oaDate = DateTimeOffset.FromUnixTimeSeconds(timestamp).DateTime.ToOADate();
_timeData.Add(oaDate);
_temperatureData.Add(temperature);
_pressureData.Add(pressure);
_vibrationData.Add(vibration);
// 保持最大点数限制
while (_timeData.Count > MaxDataPoints)
{
_timeData.RemoveAt(0);
_temperatureData.RemoveAt(0);
_pressureData.RemoveAt(0);
_vibrationData.RemoveAt(0);
}
}
private void UpdateRealTimeData()
{
var equipmentId = cmbEquipment.SelectedIndex + 1;
var latestData = _dataService.GetLatestSensorData(equipmentId);
if (latestData != null)
{
lblTemperatureValue.Text = $"{latestData.Temperature:F1}°C";
lblPressureValue.Text = $"{latestData.Pressure:F2} MPa";
lblVibrationValue.Text = $"{latestData.Vibration:F1} mm/s";
lblSpeedValue.Text = $"{latestData.Speed:F0} RPM";
lblEquipmentStatus.Text = latestData.Status;
// 根据状态设置颜色
lblEquipmentStatus.ForeColor = latestData.Status == "正常" ? System.Drawing.Color.Green : System.Drawing.Color.Red;
lblLastUpdate.Text = DateTimeOffset.FromUnixTimeSeconds(latestData.Timestamp)
.ToLocalTime().ToString("yyyy-MM-dd HH:mm:ss");
lblStatus.Text = "数据更新成功";
lblStatus.ForeColor = System.Drawing.Color.Green;
}
}
private void ChartUpdateTimer_Tick(object sender, EventArgs e)
{
UpdateCharts();
}
private void UpdateCharts()
{
if (_timeData.Count == 0) return;
var timeArray = _timeData.ToArray();
var tempArray = _temperatureData.ToArray();
var pressureArray = _pressureData.ToArray();
var vibrationArray = _vibrationData.ToArray();
// 更新温度图表
scottPlotTemperature.Plot.Remove(_temperatureScatter);
_temperatureScatter = scottPlotTemperature.Plot.Add.Scatter(timeArray, tempArray);
_temperatureScatter.Color = ScottPlot.Color.FromHex("#FF0000");
_temperatureScatter.LineWidth = 2;
_temperatureScatter.MarkerSize = 0;
if (timeArray.Length > 0)
{
var latestTime = timeArray.Last();
var windowMinutes = Math.Min(10, timeArray.Length / 60.0); // 最多显示10分钟
var earliestTime = latestTime - (windowMinutes / (24.0 * 60.0)); // OADate是以天为单位
scottPlotTemperature.Plot.Axes.SetLimitsX(earliestTime, latestTime + (0.5 / (24.0 * 60.0))); // 向前显示30秒
}
scottPlotTemperature.Refresh();
scottPlotPressure.Plot.Remove(_pressureScatter);
_pressureScatter = scottPlotPressure.Plot.Add.Scatter(timeArray, pressureArray);
_pressureScatter.Color = ScottPlot.Color.FromHex("#0000FF");
_pressureScatter.LineWidth = 2;
_pressureScatter.MarkerSize = 0;
if (timeArray.Length > 0)
{
var latestTime = timeArray.Last();
var windowMinutes = Math.Min(10, timeArray.Length / 60.0);
var earliestTime = latestTime - (windowMinutes / (24.0 * 60.0));
scottPlotPressure.Plot.Axes.SetLimitsX(earliestTime, latestTime + (0.5 / (24.0 * 60.0)));
}
scottPlotPressure.Refresh();
scottPlotVibration.Plot.Remove(_vibrationScatter);
_vibrationScatter = scottPlotVibration.Plot.Add.Scatter(timeArray, vibrationArray);
_vibrationScatter.Color = ScottPlot.Color.FromHex("#008000");
_vibrationScatter.LineWidth = 2;
_vibrationScatter.MarkerSize = 0;
if (timeArray.Length > 0)
{
var latestTime = timeArray.Last();
var windowMinutes = Math.Min(10, timeArray.Length / 60.0);
var earliestTime = latestTime - (windowMinutes / (24.0 * 60.0));
scottPlotVibration.Plot.Axes.SetLimitsX(earliestTime, latestTime + (0.5 / (24.0 * 60.0)));
}
scottPlotVibration.Refresh();
}
private void btnStartMonitoring_Click(object sender, EventArgs e)
{
ClearDataLists();
// 加载历史数据
LoadHistoricalData();
_dataCollectionTimer.Start();
_chartUpdateTimer.Start();
btnStartMonitoring.Enabled = false;
btnStopMonitoring.Enabled = true;
lblStatus.Text = "监控已启动";
lblStatus.ForeColor = System.Drawing.Color.Green;
}
private void btnStopMonitoring_Click(object sender, EventArgs e)
{
_dataCollectionTimer.Stop();
_chartUpdateTimer.Stop();
btnStartMonitoring.Enabled = true;
btnStopMonitoring.Enabled = false;
lblStatus.Text = "监控已停止";
lblStatus.ForeColor = System.Drawing.Color.Orange;
}
private void ClearDataLists()
{
_timeData.Clear();
_temperatureData.Clear();
_pressureData.Clear();
_vibrationData.Clear();
}
private void cmbEquipment_SelectedIndexChanged(object sender, EventArgs e)
{
ClearDataLists();
LoadHistoricalData();
UpdateRealTimeData();
}
private void LoadHistoricalData()
{
var equipmentId = cmbEquipment.SelectedIndex + 1;
var fromTime = DateTimeOffset.Now.AddMinutes(-5).ToUnixTimeSeconds(); // 最近5分钟
var toTime = DateTimeOffset.UtcNow.ToUnixTimeSeconds();
var historicalData = _dataService.GetSensorDataRange(equipmentId, fromTime, toTime);
if (historicalData.Count > 0)
{
// 只保留最新的1000个点
var dataToShow = historicalData.TakeLast(MaxDataPoints).ToList();
foreach (var data in dataToShow)
{
AddDataPoint(data.Timestamp, data.Temperature, data.Pressure, data.Vibration);
}
}
}
private void btnExportData_Click(object sender, EventArgs e)
{
using (var sfd = new SaveFileDialog())
{
sfd.Filter = "CSV文件|*.csv|所有文件|*.*";
sfd.FileName = $"设备数据_{DateTime.Now:yyyyMMdd_HHmmss}.csv";
if (sfd.ShowDialog() == DialogResult.OK)
{
ExportDataToCsv(sfd.FileName);
}
}
}
private void ExportDataToCsv(string fileName)
{
try
{
var equipmentId = cmbEquipment.SelectedIndex + 1;
var fromTime = dtpStartDate.Value.Date.ToUniversalTime().Subtract(DateTime.UnixEpoch).TotalSeconds;
var toTime = dtpEndDate.Value.Date.AddDays(1).ToUniversalTime().Subtract(DateTime.UnixEpoch).TotalSeconds;
var data = _dataService.GetSensorDataRange(equipmentId, (long)fromTime, (long)toTime);
var csv = new StringBuilder();
csv.AppendLine("时间,设备ID,温度(°C),压力(MPa),振动(mm/s),转速(RPM),状态");
foreach (var item in data)
{
var time = DateTimeOffset.FromUnixTimeSeconds(item.Timestamp).ToLocalTime();
csv.AppendLine($"{time:yyyy-MM-dd HH:mm:ss},{item.EquipmentId},{item.Temperature:F2}," +
$"{item.Pressure:F3},{item.Vibration:F2},{item.Speed:F0},{item.Status}");
}
System.IO.File.WriteAllText(fileName, csv.ToString(), Encoding.UTF8);
MessageBox.Show($"数据已导出到: {fileName}", "导出成功",
MessageBoxButtons.OK, MessageBoxIcon.Information);
}
catch (Exception ex)
{
MessageBox.Show($"导出失败: {ex.Message}", "错误",
MessageBoxButtons.OK, MessageBoxIcon.Error);
}
}
protected override void OnFormClosed(FormClosedEventArgs e)
{
_dataCollectionTimer?.Stop();
_chartUpdateTimer?.Stop();
_dataService?.Dispose();
base.OnFormClosed(e);
}
}
}
⚠️ 常见陷阱与解决方案
1️⃣ 内存泄漏问题
C#// ❌ 错误:不断添加新图表而不清理
_temperatureScatter = scottPlotTemperature.Plot.Add.Scatter(timeArray, tempArray);

// ✅ 正确:先移除旧图表
scottPlotTemperature.Plot.Remove(_temperatureScatter);
_temperatureScatter = scottPlotTemperature.Plot.Add.Scatter(timeArray, tempArray);
2️⃣ 颜色API变化
C#// ❌ ScottPlot 4.x 写法
tempScatter.Color = System.Drawing.Color.Red;

// ✅ ScottPlot 5.0 写法
tempScatter.Color = ScottPlot.Color.FromHex("#FF0000");
3️⃣ 数据更新频率控制
C#// 建议设置
_dataCollectionTimer.Interval = 1000;  // 数据采集:1秒
_chartUpdateTimer.Interval = 200;      // 界面刷新:200毫秒
🚀 性能优化秘籍
数据分层管理
C#// 数据采集层(高频)
private async Task CollectData()
{
    // 每秒采集数据存入数据库
    await _dataService.SaveSensorData(sensorData);
}

// 界面更新层(中频)
private void UpdateCharts()
{
    // 每200ms更新一次界面
    // 只处理内存中的最新1000个点
}
🎁 完整项目结构
C#IndustrialMonitor/
├── Models/
│   └── SensorData.cs           // 数据模型
├── Services/
│   └── DataService.cs          // 数据服务层
├── Forms/
│   └── FrmMain.cs              // 主界面
└── App.config                  // 配置文件
🔍 实际应用场景
这套方案已在多个项目中验证:
- 制造业设备监控:实时监控产线设备状态
- 环境监测系统:空气质量、温湿度监控
- 金融数据大屏:股价、交易量实时展示
💎 收藏级代码模板
C#// 万能的实时数据更新模板
public class RealTimeChartManager<T>
{
    private readonly List<double> _timeData = new();
    private readonly List<T> _valueData = new();
    private readonly int _maxPoints;
    private Scatter _scatter;

    public void AddPoint(DateTime time, T value)
    {
        _timeData.Add(time.ToOADate());
        _valueData.Add(Convert.ToDouble(value));

        while (_timeData.Count > _maxPoints)
        {
            _timeData.RemoveAt(0);
            _valueData.RemoveAt(0);
        }
    }

    public void UpdateChart(FormsPlot plot)
    {
        plot.Plot.Remove(_scatter);
        _scatter = plot.Plot.Add.Scatter(_timeData.ToArray(),
            _valueData.Select(v => Convert.ToDouble(v)).ToArray());
        plot.Refresh();
    }
}
🤔 技术思考
在实际项目中,你是否遇到过这些问题:
- 如何平衡数据精度与界面流畅度?
- 多设备监控时,如何设计数据缓存策略?
💫 核心要点总结
通过本文实战,我们掌握了三个关键技能:
- 🎯 架构设计:ScottPlot 5.0 + Lightning.NET的黄金组合,既保证了性能又简化了部署
- ⚡ 性能调优:通过数据分层、滚动窗口、合理的刷新频率,实现了千点数据的丝滑体验
- 🎨 用户体验:现代化界面设计 + 智能报警机制,让工业软件也能有颜值
在数字化转型的浪潮中,这样的实时监控系统正成为各行业的刚需。掌握了这套技术栈,你就拥有了在可视化领域的核心竞争力!
觉得这套方案对你的项目有帮助吗?欢迎在评论区分享你的实战经验,或者遇到的技术难题。让我们一起把C#开发做得更专业!
🔗 相关推荐:下期将分享"微服务架构下的分布式监控方案",记得关注哦~
相关信息
通过网盘分享的文件:AppLightningDbMonitor.zip 链接: https://pan.baidu.com/s/1qlpMD4Wkxdduh1sjxBSTmA?pwd=wgq6 提取码: wgq6 --来自百度网盘超级会员v9的分享
本文作者:技术老小子
本文链接:
版权声明:本博客所有文章除特别声明外,均采用 BY-NC-SA 许可协议。转载请注明出处!
目录