
目录
🎯 数字够用,但仪表盘更直观
工控项目里有一个很典型的场景:操作员面对一屏幕的数字——转速 1450rpm、温度 78.3°C、压力 4.2MPa、电流 18.6A——每隔几秒刷新一次。数字本身没问题,但人眼处理纯数字的效率远不如处理图形。操作员需要在脑子里换算"1450 在正常范围内吗",这个认知转换在高压操作环境下是实实在在的负担。
仪表盘图(Gauge Chart) 的价值正在于此——把数值的"位置感"直接用视觉表达出来。指针指向绿色区域,一切正常;偏向红色,立刻警觉。不需要记忆阈值,不需要心算,视觉语言直接触发判断。
LiveCharts 2 的 PieChart 配合 GaugeBuilder 提供了完整的仪表盘实现方案,支持单值仪表、多段色阶、动态数值更新,几十行代码就能搭出专业级效果。
读完本文,你将掌握:
- ✅
GaugeBuilder的基础用法与参数配置 - ✅ 三段色阶告警仪表盘(绿/黄/红分区)
- ✅ 多仪表盘并排布局与动态实时刷新
🔍 问题深度剖析:为什么数字显示不够用?
认知负担是真实的工程问题
人类视觉系统对"位置"和"颜色"的处理速度,比对"数字"的处理速度快 3~5 倍。在需要同时监控 8~12 个参数的工控场景里,纯数字界面要求操作员对每个参数都有记忆阈值,这本质上是在用人脑做数据库查询。
仪表盘图把这个查询过程外包给视觉系统——绿色区域就是正常,红色区域就是异常,不需要任何记忆和计算。
LiveCharts 2 的仪表盘实现方式与直觉不同
很多开发者第一次接触 LiveCharts 2 的仪表盘时会困惑:它没有专门的 GaugeChart 控件,而是用 PieChart + GaugeBuilder 来实现。以前是用GaugeBuilder 是一个工厂类,它把普通的饼图系列组合成仪表盘的视觉形态,理解这个设计后,配置就会清晰很多。
核心数据类型是 GaugeItem,它代表仪表盘上的一个"填充段"。通过组合多个 GaugeItem,可以实现分段色阶、背景轨道、当前值指示等效果。
常见误区:把 PieChart 的属性搬到仪表盘上
PieChart 的 InitialRotation 和 MaxAngle 两个属性在仪表盘场景里至关重要——InitialRotation 控制仪表盘的起始角度(通常设为 -225° 让仪表从左下角开始),MaxAngle 控制仪表盘的总弧度(通常设为 270° 形成经典的 3/4 圆弧)。很多开发者忽略这两个属性,结果仪表盘变成了一个完整的圆饼,失去了仪表的形态感。
💡 核心要点提炼
GaugeBuilder 这个在以前版本可以用,现在正式版本API 改为 GaugeGenerator.BuildSolidGauge() + GaugeItem,并且入口命名空间变成了 LiveChartsCore.SkiaSharpView.Extensions。
几个关键属性值得重点理解:
InnerRadius:仪表盘内圆半径,控制仪表的"厚度"感,值越大仪表弧越细MaxRadialColumnWidth:弧最大宽度OuterRadiusOffset:控制弧外边缘与控件最大半径之间的留白距离,多层嵌套仪表盘时用于分层错开。
GaugeItem 的第一个参数是数值,第二个参数是该段的画笔(颜色),通过组合多个 GaugeItem 实现分段色阶。
🛠️ 方案一:基础单值仪表盘
场景描述
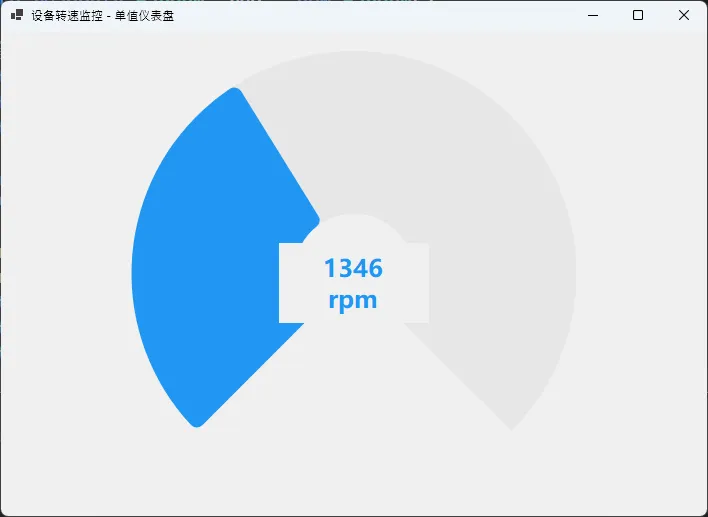
展示单台设备的转速,量程 0~3000rpm,当前值动态刷新,经典的半圆仪表盘形态。
csharpusing LiveChartsCore;
using LiveChartsCore.Measure;
using LiveChartsCore.SkiaSharpView.Extensions;
using LiveChartsCore.SkiaSharpView.Painting;
using LiveChartsCore.SkiaSharpView.WinForms;
using SkiaSharp;

namespace AppLiveChart19
{
    public partial class Form1 : Form
    {
        private readonly System.Windows.Forms.Timer _timer;
        private readonly Random _rng = new Random();

        // 用普通 double 字段存当前转速,手动刷新 Series
        private double _currentRpm = 1200;
        private PieChart _chart = null!;
        private Label _label = null!;

        public Form1()
        {
            InitializeComponent();
            InitGaugeChart();
            _timer = new System.Windows.Forms.Timer { Interval = 1000 };
            _timer.Tick += OnTick;
            _timer.Start();
        }

        private IEnumerable<ISeries> BuildSeries(double rpm)
        {
            return GaugeGenerator.BuildSolidGauge(
                // 前景弧:当前转速值
                new GaugeItem(rpm, series =>
                {
                    series.Fill = new SolidColorPaint(new SKColor(33, 150, 243));
                    series.InnerRadius = 60;
                    series.DataLabelsSize = 0;       // 不在弧上显示数字,用 Label 代替
                }),
                // 背景轨道
                new GaugeItem(GaugeItem.Background, series =>
                {
                    series.Fill = new SolidColorPaint(new SKColor(230, 230, 230));
                    series.InnerRadius = 60;
                })
            );
        }

        private void InitGaugeChart()
        {
            Text = "设备转速监控 - 单值仪表盘";
            Size = new System.Drawing.Size(400, 380);

            _chart = new PieChart
            {
                Dock = DockStyle.Fill,
                Series = BuildSeries(_currentRpm),
                InitialRotation = -225,
                MaxAngle = 270,
                MinValue = 0,
                MaxValue = 3000,
                LegendPosition = LegendPosition.Hidden
            };
            Controls.Add(_chart);

            _label = new Label
            {
                AutoSize = false,
                TextAlign = System.Drawing.ContentAlignment.MiddleCenter,
                Font = new System.Drawing.Font("微软雅黑", 18f, System.Drawing.FontStyle.Bold),
                ForeColor = System.Drawing.Color.FromArgb(33, 150, 243),
                BackColor = System.Drawing.Color.Transparent,
                Text = "1200\nrpm",
                Size = new System.Drawing.Size(150, 80)
            };

            void PositionLabel()
            {
                _label.Location = new System.Drawing.Point(
                    (ClientSize.Width - _label.Width) / 2,
                    (ClientSize.Height - _label.Height) / 2 + 10
                );
            }
            PositionLabel();
            Resize += (s, e) => PositionLabel();
            Controls.Add(_label);
            _label.BringToFront();
        }

        private void OnTick(object? sender, EventArgs e)
        {
            double newRpm = 1500 + Math.Sin(DateTime.Now.Second * 0.5) * 600
                                 + _rng.NextDouble() * 200 - 100;
            newRpm = Math.Clamp(newRpm, 0, 3000);
            _currentRpm = Math.Round(newRpm);

            // ✅ 重新构建 Series 让图表刷新
            _chart.Series = BuildSeries(_currentRpm);

            _label.Text = $"{_currentRpm:F0}\nrpm";
            _label.ForeColor = _currentRpm > 2500
                ? System.Drawing.Color.FromArgb(244, 67, 54)
                : System.Drawing.Color.FromArgb(33, 150, 243);
        }

        protected override void OnFormClosed(FormClosedEventArgs e)
        {
            _timer?.Stop();
            _timer?.Dispose();
            base.OnFormClosed(e);
        }
    }
}
踩坑预警
InitialRotation = -225 和 MaxAngle = 270 这两个值是配套的,缺一不可。只设 MaxAngle 不设 InitialRotation,仪表盘会从右侧水平方向开始,形态怪异。只设 InitialRotation 不设 MaxAngle,仪表盘会是完整的圆。两个值要一起配置才能得到经典的 3/4 圆弧仪表形态。
🛠️ 方案二:三段色阶告警仪表盘
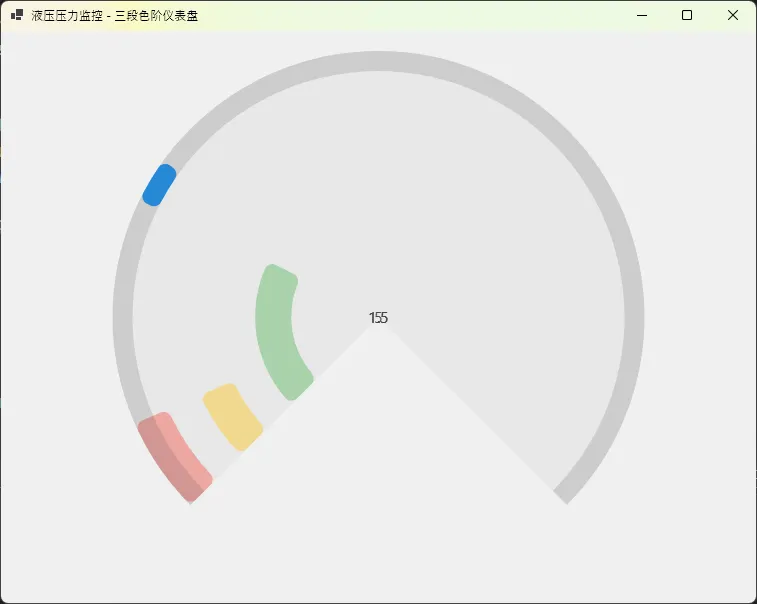
这是生产环境里最实用的形态。量程分为绿(正常)、黄(警告)、红(危险)三段,指针当前位置的颜色直接传递告警状态,不需要任何文字说明。
csharpusing LiveChartsCore;
using LiveChartsCore.Defaults;
using LiveChartsCore.Measure;
using LiveChartsCore.SkiaSharpView;
using LiveChartsCore.SkiaSharpView.Extensions;
using LiveChartsCore.SkiaSharpView.Painting;
using LiveChartsCore.SkiaSharpView.WinForms;
using SkiaSharp;

namespace AppLiveChart19
{
    public partial class Form2 : Form
    {
        private PieChart _chart = null!;
        private readonly Random _rng = new Random();
        private readonly ObservableValue _pressureValue = new ObservableValue(4.2);

        // 自绘文字状态
        private string _displayText = "4.2 MPa";
        private System.Drawing.Color _displayColor =
            System.Drawing.Color.FromArgb(56, 142, 60);

        public Form2()
        {
            InitializeComponent();
            InitAlertGaugeChart();
        }

        //  构建仪表盘 Series
        private IEnumerable<ISeries> BuildSeries(double pressure)
        {
            // 层1:三段色阶背景(绿/黄/红),首尾相接拼成完整轨道
            var bgSeries = GaugeGenerator.BuildSolidGauge(
                new GaugeItem(5, s =>
                {
                    s.Fill = new SolidColorPaint(new SKColor(76, 175, 80, 100));
                    s.InnerRadius = 52;
                    s.MaxRadialColumnWidth = 36;
                    s.ZIndex = 0;
                }),
                new GaugeItem(1.5, s =>
                {
                    s.Fill = new SolidColorPaint(new SKColor(255, 193, 7, 100));
                    s.InnerRadius = 52;
                    s.MaxRadialColumnWidth = 36;
                    s.ZIndex = 0;
                }),
                new GaugeItem(1.5, s =>
                {
                    s.Fill = new SolidColorPaint(new SKColor(244, 67, 54, 100));
                    s.InnerRadius = 52;
                    s.MaxRadialColumnWidth = 36;
                    s.ZIndex = 0;
                })
            );

            // 层2:当前压力值前景弧,颜色随压力区间变化
            var fgColor = pressure switch
            {
                <= 5.0 => new SKColor(33, 150, 243),   // 正常:蓝
                <= 6.5 => new SKColor(255, 152, 0),   // 警告:橙
                _ => new SKColor(244, 67, 54)    // 危险:红
            };

            var fgSeries = GaugeGenerator.BuildSolidGauge(
                new GaugeItem(pressure, s =>
                {
                    s.Fill = new SolidColorPaint(fgColor);
                    s.InnerRadius = 58;
                    s.MaxRadialColumnWidth = 20;
                    s.ZIndex = 1;
                    s.DataLabelsSize = 0;
                }),
                new GaugeItem(GaugeItem.Background, s =>
                {
                    s.Fill = new SolidColorPaint(new SKColor(60, 60, 60, 40));
                    s.InnerRadius = 58;
                    s.MaxRadialColumnWidth = 20;
                    s.ZIndex = 0;
                })
            );

            return bgSeries.Concat(fgSeries);
        }

        //  更新文字颜色与内容,触发重绘
        private void UpdateLabelStyle(double v)
        {
            _displayText = $"{v:F1} MPa";
            _displayColor = v switch
            {
                <= 5.0 => System.Drawing.Color.FromArgb(56, 142, 60),
                <= 6.5 => System.Drawing.Color.FromArgb(245, 127, 23),
                _ => System.Drawing.Color.FromArgb(211, 47, 47)
            };
            _chart.Invalidate();
        }

        private void InitAlertGaugeChart()
        {
            Text = "液压压力监控 - 三段色阶仪表盘";
            Size = new System.Drawing.Size(420, 400);

            _chart = new PieChart
            {
                Dock = DockStyle.Fill,
                Series = BuildSeries(_pressureValue.Value ?? 0),
                InitialRotation = -225,
                MaxAngle = 270,
                MinValue = 0,
                MaxValue = 8,
                LegendPosition = LegendPosition.Hidden
            };

            //  自绘中心文字,彻底透明无背景
            _chart.Paint += (s, e) =>
            {
                using var font = new System.Drawing.Font("微软雅黑", 16f,
                                      System.Drawing.FontStyle.Bold);
                using var brush = new System.Drawing.SolidBrush(_displayColor);

                var size = e.Graphics.MeasureString(_displayText, font);
                float x = (_chart.Width - size.Width) / 2f;
                float y = (_chart.Height - size.Height) / 2f + 15f;
                e.Graphics.DrawString(_displayText, font, brush, x, y);
            };

            Controls.Add(_chart);

            UpdateLabelStyle(4.2);

            //  定时刷新
            var timer = new System.Windows.Forms.Timer { Interval = 1200 };
            timer.Tick += (s, e) =>
            {
                double newP = 3.5 + Math.Sin(DateTime.Now.Second * 0.3) * 2.5
                                  + _rng.NextDouble() * 0.6 - 0.3;
                newP = Math.Clamp(Math.Round(newP, 1), 0, 8);

                _chart.Series = BuildSeries(newP);
                UpdateLabelStyle(newP);
            };
            timer.Start();
        }

        protected override void OnFormClosed(FormClosedEventArgs e)
        {
            base.OnFormClosed(e);
        }
    }
}
🛠️ 方案三:多仪表盘并排布局
csharpusing LiveChartsCore;
using LiveChartsCore.Defaults;
using LiveChartsCore.Measure;
using LiveChartsCore.SkiaSharpView;
using LiveChartsCore.SkiaSharpView.Extensions;
using LiveChartsCore.SkiaSharpView.Painting;
using LiveChartsCore.SkiaSharpView.WinForms;
using SkiaSharp;

namespace AppLiveChart19
{
    public partial class Form3 : Form
    {
        private readonly Random _rng = new Random();

        private record GaugeConfig(
            string Title, string Unit,
            double InitValue, double MaxValue,
            double WarnValue, double DangerValue);

        private readonly GaugeConfig[] _configs = new[]
        {
            new GaugeConfig("电机转速", "RPM", 3200, 6000, 4000, 5500),
            new GaugeConfig("油温",     "°C",  75,   120,  90,   105),
            new GaugeConfig("负载率",   "%",   62,   100,  75,   90)
        };

        // 每列背景色与窗体一致,Label Transparent 才能正确继承
        private static readonly System.Drawing.Color BgColor =
            System.Drawing.Color.FromArgb(30, 30, 30);

        private PieChart[] _charts = null!;
        private Label[] _valLabels = null!;   // 数值
        private Label[] _unitLabels = null!;   // 单位
        private double[] _currentValues = null!;

        public Form3()
        {
            InitializeComponent();
            InitMultiGauge();
        }

        private SKColor GetFgSKColor(int idx)
        {
            double v = _currentValues[idx]; var c = _configs[idx];
            return v <= c.WarnValue ? new SKColor(33, 150, 243)
                 : v <= c.DangerValue ? new SKColor(255, 152, 0)
                 : new SKColor(244, 67, 54);
        }

        private System.Drawing.Color GetFgDrawColor(int idx)
        {
            double v = _currentValues[idx]; var c = _configs[idx];
            return v <= c.WarnValue ? System.Drawing.Color.FromArgb(33, 150, 243)
                 : v <= c.DangerValue ? System.Drawing.Color.FromArgb(255, 152, 0)
                 : System.Drawing.Color.FromArgb(244, 67, 54);
        }

        private IEnumerable<ISeries> BuildSeries(int idx)
        {
            var cfg = _configs[idx];
            double val = _currentValues[idx];
            double rem = Math.Max(cfg.MaxValue - val, 0);

            var bg = GaugeGenerator.BuildSolidGauge(
                new GaugeItem(GaugeItem.Background, s =>
                {
                    s.Fill = new SolidColorPaint(new SKColor(70, 70, 70));
                    s.InnerRadius = 48;
                    s.MaxRadialColumnWidth = 28;
                }));

            var fg = GaugeGenerator.BuildSolidGauge(
                new GaugeItem(val, s =>
                {
                    s.Fill = new SolidColorPaint(GetFgSKColor(idx));
                    s.InnerRadius = 48;
                    s.MaxRadialColumnWidth = 28;
                    s.DataLabelsSize = 0;
                }),
                new GaugeItem(rem, s =>
                {
                    s.Fill = new SolidColorPaint(
                                               new SKColor(50, 50, 50, 200));
                    s.InnerRadius = 48;
                    s.MaxRadialColumnWidth = 28;
                    s.DataLabelsSize = 0;
                }));

            return bg.Concat(fg);
        }

        private void InitMultiGauge()
        {
            Text = "电机监控 - 多仪表盘并排";
            Size = new System.Drawing.Size(780, 300);
            BackColor = BgColor;

            int n = _configs.Length;
            _charts = new PieChart[n];
            _valLabels = new Label[n];
            _unitLabels = new Label[n];
            _currentValues = new double[n];

            for (int i = 0; i < n; i++)
                _currentValues[i] = _configs[i].InitValue;

            var table = new TableLayoutPanel
            {
                Dock = DockStyle.Fill,
                RowCount = 1,
                ColumnCount = n,
                BackColor = BgColor,
                Padding = new Padding(4)
            };
            table.RowStyles.Add(new RowStyle(SizeType.Percent, 100f));
            for (int i = 0; i < n; i++)
                table.ColumnStyles.Add(
                    new ColumnStyle(SizeType.Percent, 100f / n));

            for (int i = 0; i < n; i++)
            {
                int idx = i;
                var cfg = _configs[idx];

                // ── cell:与窗体同色,Label 的 Transparent 才有效 ────
                var cell = new Panel
                {
                    Dock = DockStyle.Fill,
                    BackColor = BgColor
                };

                // PieChart 底层
                _charts[idx] = new PieChart
                {
                    Dock = DockStyle.Fill,
                    Series = BuildSeries(idx),
                    InitialRotation = -225,
                    MaxAngle = 270,
                    MinValue = 0,
                    MaxValue = cfg.MaxValue,
                    LegendPosition = LegendPosition.Hidden,
                    TooltipPosition = TooltipPosition.Hidden,
                    BackColor = BgColor
                };
                cell.Controls.Add(_charts[idx]);


                var titleLbl = new Label
                {
                    Text = cfg.Title,
                    AutoSize = false,
                    Dock = DockStyle.Top,
                    Height = 24,
                    TextAlign = System.Drawing.ContentAlignment.MiddleCenter,
                    ForeColor = System.Drawing.Color.FromArgb(150, 150, 150),
                    BackColor = BgColor,
                    Font = new System.Drawing.Font("微软雅黑", 9f)
                };
                cell.Controls.Add(titleLbl);
                titleLbl.BringToFront();


                _valLabels[idx] = new Label
                {
                    AutoSize = false,
                    TextAlign = System.Drawing.ContentAlignment.BottomCenter,
                    ForeColor = GetFgDrawColor(idx),
                    // ✅ 关键:BackColor 与 cell/PieChart 完全一致
                    //    视觉上与背景融合,等效"无背景"
                    BackColor = BgColor,
                    Font = new System.Drawing.Font("微软雅黑", 18f,
                                    System.Drawing.FontStyle.Bold),
                    Size = new System.Drawing.Size(110, 36),
                    Text = $"{cfg.InitValue:F0}"
                };


                _unitLabels[idx] = new Label
                {
                    AutoSize = false,
                    TextAlign = System.Drawing.ContentAlignment.TopCenter,
                    ForeColor = System.Drawing.Color.FromArgb(130, 130, 130),
                    BackColor = BgColor,
                    Font = new System.Drawing.Font("微软雅黑", 9f),
                    Size = new System.Drawing.Size(80, 20),
                    Text = cfg.Unit
                };

                cell.Controls.Add(_valLabels[idx]);
                cell.Controls.Add(_unitLabels[idx]);
                _valLabels[idx].BringToFront();
                _unitLabels[idx].BringToFront();

                // 居中定位,Resize 时重算
                void Reposition()
                {
                    var vl = _valLabels[idx];
                    var ul = _unitLabels[idx];
                    int cx = cell.Width / 2;
                    int cy = cell.Height / 2;
                    vl.Location = new System.Drawing.Point(
                        cx - vl.Width / 2, cy - vl.Height - 2);
                    ul.Location = new System.Drawing.Point(
                        cx - ul.Width / 2, cy + 2);
                }
                cell.Resize += (s, e) => Reposition();
                cell.HandleCreated += (s, e) => Reposition();

                table.Controls.Add(cell, idx, 0);
            }

            Controls.Add(table);

            var timer = new System.Windows.Forms.Timer { Interval = 1000 };
            timer.Tick += (s, e) =>
            {
                double t = DateTime.Now.Second;

                _currentValues[0] = Math.Clamp(Math.Round(
                    3000 + Math.Sin(t * 0.4) * 1800 + _rng.NextDouble() * 300 - 150),
                    0, _configs[0].MaxValue);

                _currentValues[1] = Math.Clamp(Math.Round(
                    80 + Math.Sin(t * 0.15) * 22 + _rng.NextDouble() * 4 - 2, 1),
                    0, _configs[1].MaxValue);

                _currentValues[2] = Math.Clamp(Math.Round(
                    65 + Math.Sin(t * 0.25) * 25 + _rng.NextDouble() * 6 - 3, 1),
                    0, _configs[2].MaxValue);

                for (int i = 0; i < n; i++)
                {
                    _charts[i].Series = BuildSeries(i);
                    _valLabels[i].Text = $"{_currentValues[i]:F0}";
                    _valLabels[i].ForeColor = GetFgDrawColor(i);
                }
            };
            timer.Start();
        }

        protected override void OnFormClosed(FormClosedEventArgs e)
        {
            base.OnFormClosed(e);
        }
    }
}
踩坑预警
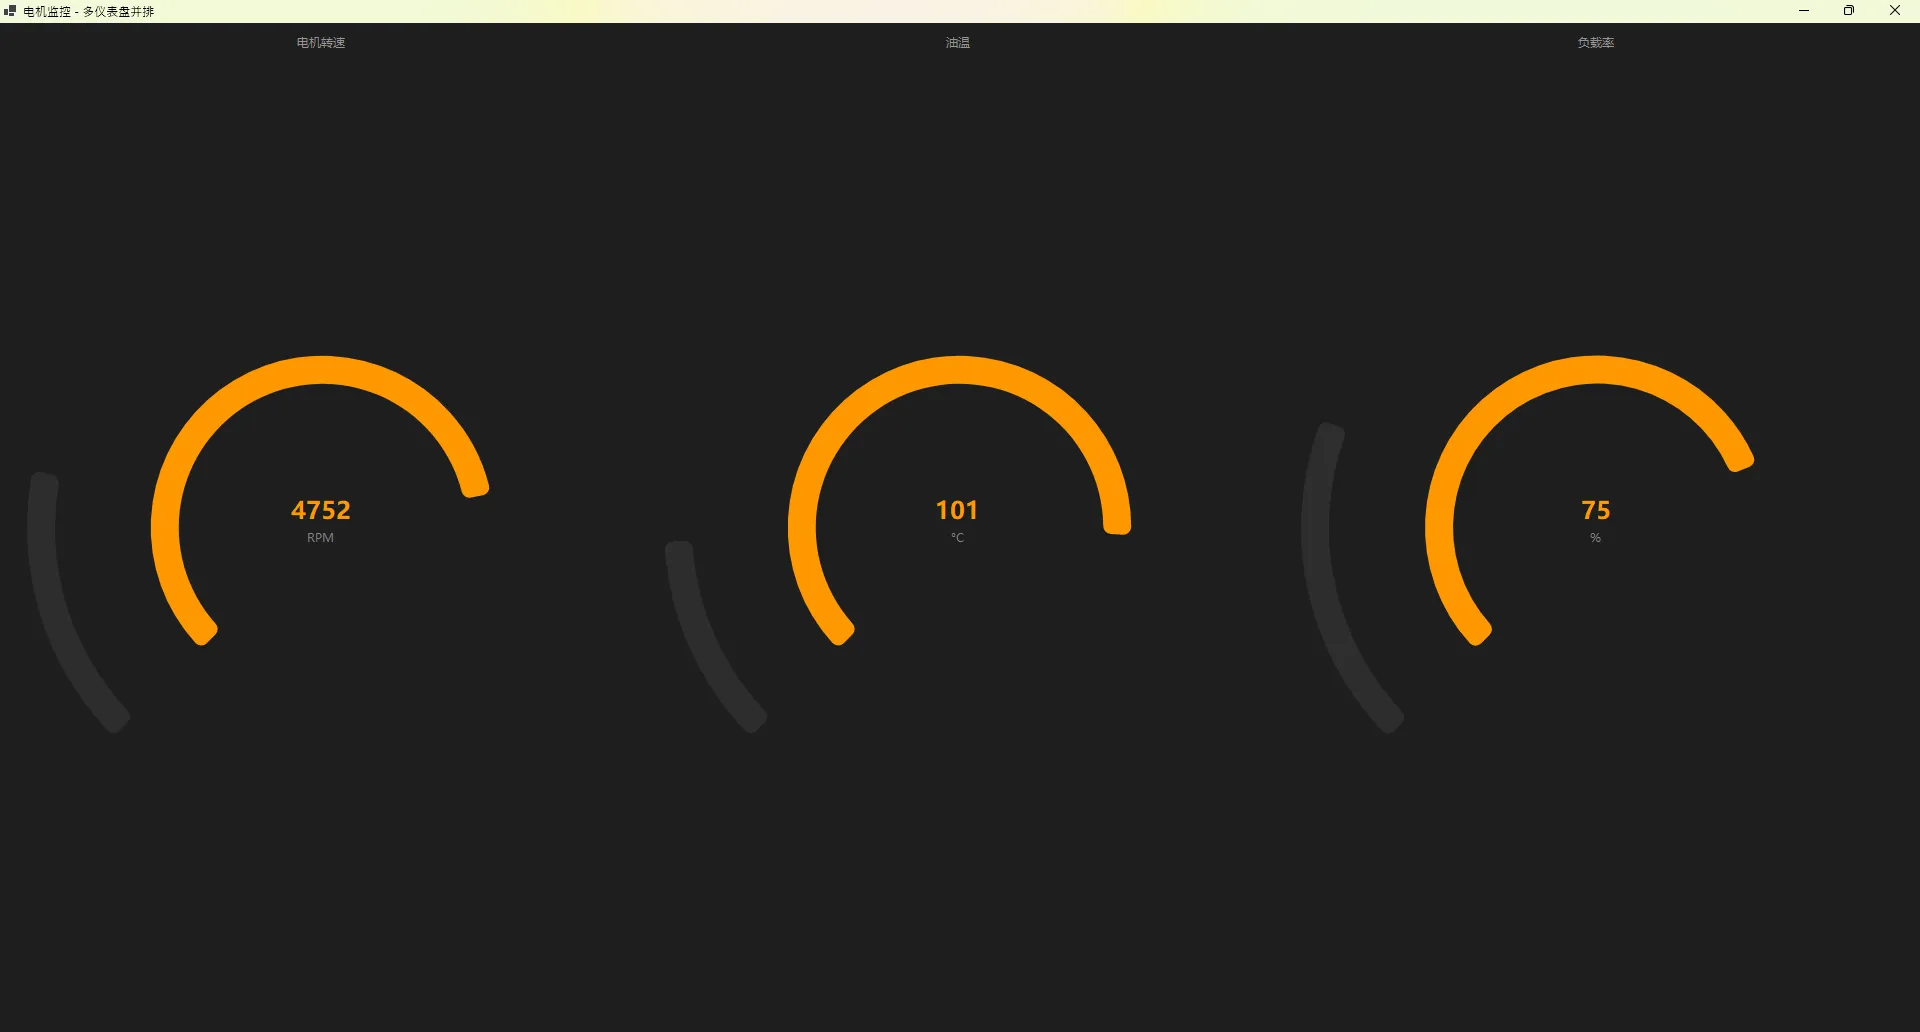
InitialRotation = -225 和 MaxAngle = 270 是标准仪表盘的固定搭配,不要随意修改。-225 让仪表盘从左下角(7 点钟方向)开始,270 让它扫过 3/4 圆弧到右下角(5 点钟方向),这是工业仪表盘的行业标准外观。如果改成 -180 + 180,就变成了半圆仪表盘,视觉上不够直观。
⚠️ 常见问题与规避策略
问题一:仪表盘显示为完整圆形,不是 3/4 弧
检查 InitialRotation 和 MaxAngle 是否设置在 GaugeSeries 上,而不是 GaugeItem 上。这两个属性只在 GaugeSeries 级别生效。
问题二:中心数值标签位置偏移
DataLabelsFormatter 显示的标签位置由 LiveCharts 2 内部计算,在窗体 Resize 时可能偏移。如果需要精确居中,建议改用叠加 Label 控件的方式(方案二的做法),通过 chart.Resize 事件动态重新定位。
问题三:多个 GaugeItem 颜色混乱
GaugeItem 的颜色配置在构造函数的 Action<PieSeries<ObservableValue>> 回调里设置,如果用 lambda 捕获了循环变量 i,会出现经典的"闭包陷阱"——所有仪表盘显示同一颜色。方案三里用 var cfg = GaugeConfigs[i] 提前捕获值类型变量来规避这个问题。
📊 性能参考数据
测试环境:Windows 11 / i7-12700H / .NET 6.0 / Release 模式
| 场景 | 仪表盘数量 | 刷新间隔 | CPU 占用 | 内存占用 |
|---|---|---|---|---|
| 单表盘静态 | 1 | — | ~0.5% | ~42MB |
| 单表盘动态 | 1 | 1000ms | ~1.2% | ~44MB |
| 三表盘动态 | 3 | 1000ms | ~2.8% | ~58MB |
| 六表盘动态 | 6 | 500ms | ~6.5% | ~75MB |
六个仪表盘 500ms 刷新,CPU 占用不到 7%,在工控机(通常配置较低)上也完全可以接受。如果需要更多表盘,建议把刷新间隔拉长到 1~2 秒,或者只刷新数值变化超过阈值的表盘。
💬 技术讨论
仪表盘图在工控场景里的设计其实有很多值得深入的细节。比如"量程设置"这个问题——量程太宽,指针永远在中间附近摆动,细微变化看不出来;量程太窄,稍微波动就触发视觉告警,操作员会产生"狼来了"的疲劳感。你在项目里是怎么确定仪表盘量程的?有没有动态调整量程的需求?
另外抛一个工程思考题:如果需要在仪表盘上增加"历史峰值标记"(类似汽车转速表上的红色峰值指针),用 LiveCharts 2 的现有 API 你会怎么实现? 欢迎在评论区分享思路。
🎯 总结
本文围绕 LiveCharts 2 的 GaugeSeries 在工业参数监控场景中的工程实践,梳理了三个渐进式方案:
- 方案一:基础单指针仪表盘,掌握
GaugeItem+GaugeSeries+PieChart的核心组合,InitialRotation = -225和MaxAngle = 270是标准仪表盘的固定配置 - 方案二:三色告警仪表盘,通过数据层预计算实现绿→黄→红的分段点亮效果,让告警状态在视觉上一目了然
- 方案三:多表盘并排 + 实时刷新,直接修改
GaugeItem.Value触发重绘,性能开销极低,适合工控面板的工程落地
仪表盘图的核心价值不是"好看",而是把认知负担从操作员身上转移到视觉系统,让"判断是否安全"这个动作在毫秒级完成。这个设计原则同样适用于所有工控 UI 的设计决策。
#C# #WinForms #LiveCharts2 #工业数据可视化 #仪表盘 #实时监控
相关信息
我用夸克网盘给你分享了「AppLiveChart19.zip」,点击链接或复制整段内容,打开「夸克APP」即可获取。
/757a3YmgjW:/
链接:https://pan.quark.cn/s/8ec710d9e206
提取码:LZct


本文作者:技术老小子
本文链接:
版权声明:本博客所有文章除特别声明外,均采用 BY-NC-SA 许可协议。转载请注明出处!