
目录
🔍 坐标轴配错,图表白做
做过数据可视化项目的开发者,大概都经历过这样的场景:图表渲染出来了,数据也对,但坐标轴的刻度密得像蚂蚁,标签挤在一起完全看不清;或者范围自动计算出了一个莫名其妙的区间,明明数据在 0~100 之间,轴却从 -23 跑到了 147。
这类问题表面上是"显示问题",实际上影响的是数据传递的效率。一张坐标轴配置混乱的图表,用户需要花额外的认知成本去理解,业务价值大打折扣。
LiveCharts 2 的坐标轴系统功能相当丰富,但官方文档对很多细节语焉不详,实际项目里需要大量试错才能摸清门道。读完这篇文章,你将掌握:
- 标签格式化的完整配置方式,覆盖时间、货币、百分比等常见场景
- 刻度间距与密度的精确控制,告别"刻度挤成一堆"的窘境
- 范围固定与动态范围的使用边界,以及实时数据场景下的最优策略
🧩 问题深度剖析:坐标轴为什么总是"不听话"
自动范围的计算逻辑与副作用
LiveCharts 2 默认开启自动范围计算,它会根据当前数据集的最小值和最大值动态调整坐标轴边界。这个机制在静态数据场景下工作得还不错,但有两个隐患容易被忽视。
第一个隐患是"视觉抖动"。 在实时数据场景下,每当新数据点进来,坐标轴范围就可能重新计算一次。如果数据波动范围不稳定,轴的边界会持续跳变,用户盯着图表会感觉整张图在"呼吸",极度影响阅读体验。
第二个隐患是"边距缺失"。 自动范围会让数据点贴着坐标轴边界,最高点和最低点几乎碰到轴线。这在视觉上非常压抑,而且容易让用户误以为数据已经"触顶"或"触底"。
标签格式化的常见误区
很多开发者第一次接触 LiveCharts 2 的标签配置时,会直接用 Labeler 属性传入一个 lambda,但忽略了一个关键细节:Labeler 接收的参数是 double 类型的轴值,而不是原始数据对象。这意味着如果你的 X 轴是时间序列,传入的值是时间戳的数值表示,需要手动转换,否则显示出来的就是一串数字。
刻度密度的控制盲区
MinStep 属性控制刻度的最小间距,但很多人不清楚它的单位是"轴值单位"而不是像素。设置 MinStep = 1 在数值范围是 0~10 时效果合理,但在范围是 0~100000 时,刻度会密得完全无法辨认。这个属性需要结合实际数据量级来配置,没有一个通用的"正确值"。
📐 核心机制:Axis 对象的关键属性全景
在深入方案之前,先把 Axis 类的核心属性梳理清楚,这是后续所有配置的基础。
LiveCharts 2 中,坐标轴通过 CartesianChart.XAxes 和 CartesianChart.YAxes 配置,每个轴是一个 Axis 对象(命名空间 LiveChartsCore.SkiaSharpView)。
| 属性 | 类型 | 作用 |
|---|---|---|
Labeler | Func<double, string> | 自定义标签文本 |
MinStep | double | 刻度最小间距(轴值单位) |
MinLimit | double? | 轴最小值(null = 自动) |
MaxLimit | double? | 轴最大值(null = 自动) |
ForceStepToMin | bool | 强制以 MinStep 为间距生成刻度 |
LabelsPaint | IPaint<SkiaSharpDrawingContext> | 标签字体颜色与样式 |
SeparatorsPaint | IPaint<SkiaSharpDrawingContext> | 网格线样式 |
TicksPaint | IPaint<SkiaSharpDrawingContext> | 刻度线样式 |
Name | string | 轴标题 |
NamePadding | Padding | 轴标题与轴线的间距 |
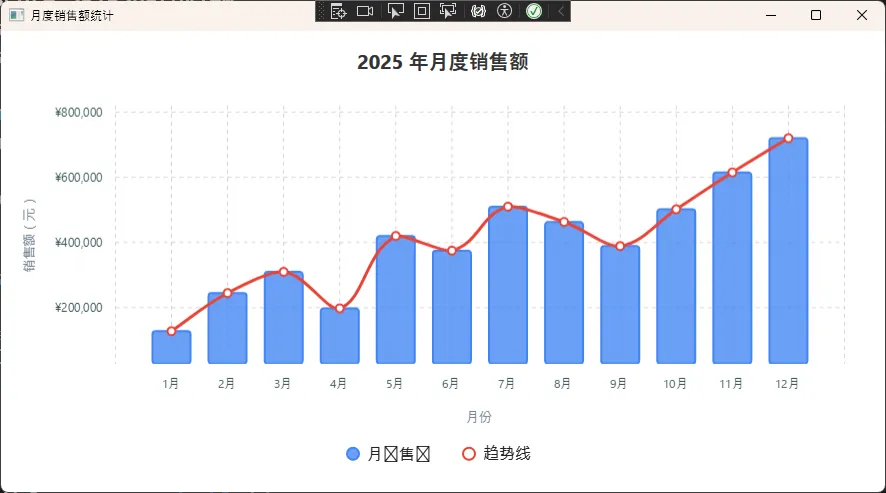
🚀 方案一:标签格式化的完整实践
这是使用频率最高的配置场景,覆盖数值、时间、百分比三种典型需求。
数值标签:货币与科学计数法
csharpusing LiveChartsCore;
using LiveChartsCore.SkiaSharpView;
using LiveChartsCore.SkiaSharpView.Painting;
using LiveChartsCore.SkiaSharpView.Painting.Effects;
using SkiaSharp;
using System.ComponentModel;
using System.Runtime.CompilerServices;

namespace AppLiveChart08
{
    public class MainViewModel : INotifyPropertyChanged
    {
        public ISeries[] Series { get; set; } = new ISeries[]
        {
            new ColumnSeries<double>
            {
                Name = "月销售额",
                Values = new double[]
                {
                    128000, 245000, 310000, 198000,
                    420000, 375000, 510000, 463000,
                    389000, 502000, 615000, 720000
                },
                Fill = new SolidColorPaint(new SKColor(66, 133, 244, 200)),
                Stroke = new SolidColorPaint(new SKColor(66, 133, 244), 2),
                MaxBarWidth = 40,
            },
            new LineSeries<double>
            {
                Name = "趋势线",
                Values = new double[]
                {
                    128000, 245000, 310000, 198000,
                    420000, 375000, 510000, 463000,
                    389000, 502000, 615000, 720000
                },
                Stroke = new SolidColorPaint(new SKColor(234, 67, 53), 3),
                Fill = null,
                GeometrySize = 8,
                GeometryStroke = new SolidColorPaint(new SKColor(234, 67, 53), 2),
                GeometryFill = new SolidColorPaint(SKColors.White),
            }
        };

        public Axis[] XAxes { get; set; } = new[]
        {
            new Axis
            {
                Name = "月份",
                NamePaint = new SolidColorPaint(SKColors.SlateGray),
                NameTextSize = 13,
                Labels = new[]
                {
                    "1月","2月","3月","4月",
                    "5月","6月","7月","8月",
                    "9月","10月","11月","12月"
                },
                LabelsPaint = new SolidColorPaint(SKColors.DarkSlateGray),
                TextSize = 12,
                SeparatorsPaint = new SolidColorPaint(SKColors.LightGray)
                {
                    StrokeThickness = 1,
                    PathEffect = new DashEffect(new float[] { 4, 4 })
                },
            }
        };

        public Axis[] YAxes { get; set; } = new[]
        {
            new Axis
            {
                Name = "销售额(元)",
                NamePaint = new SolidColorPaint(SKColors.SlateGray),
                NameTextSize = 13,
                LabelsPaint = new SolidColorPaint(SKColors.DarkSlateGray),
                TextSize = 12,
                Labeler = value => $"¥{value:N0}",
                MinStep = 50000,
                SeparatorsPaint = new SolidColorPaint(SKColors.LightGray)
                {
                    StrokeThickness = 1,
                    PathEffect = new DashEffect(new float[] { 4, 4 })
                },
            }
        };

        public event PropertyChangedEventHandler? PropertyChanged;
        protected void OnPropertyChanged([CallerMemberName] string? name = null)
            => PropertyChanged?.Invoke(this, new PropertyChangedEventArgs(name));
    }
}
如果数据量级很大(比如传感器采集的原始 ADC 值,动辄百万级),切换科学计数法更清晰:
csharpLabeler = value => value >= 1_000_000
    ? $"{value / 1_000_000:F1}M"
    : value >= 1_000
        ? $"{value / 1_000:F1}K"
        : value.ToString("F0"),
这个写法会根据量级自动切换单位,1500000 显示为"1.5M",85000 显示为"85.0K",小于 1000 的直接显示整数。实际项目里这比固定格式字符串要友好得多。
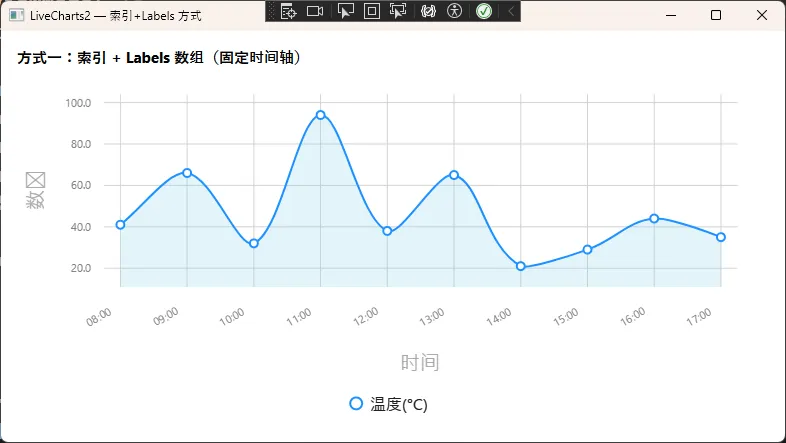
时间轴标签:从时间戳到可读时间
LiveCharts 2 处理时间序列时,X 轴通常存储的是 DateTime.Ticks 转换后的数值,或者直接用索引配合 Labels 数组。两种方式各有适用场景。
方式一:使用 Labels 数组(适合固定时间点)
csharpusing System.Collections.ObjectModel;
using System.ComponentModel;
using System.Runtime.CompilerServices;
using System.Windows.Threading;
using LiveChartsCore;
using LiveChartsCore.Defaults;
using LiveChartsCore.SkiaSharpView;
using LiveChartsCore.SkiaSharpView.Painting;
using SkiaSharp;

namespace AppLiveChart08
{
    public class ViewModel : INotifyPropertyChanged
    {
        //  静态时间标签(X 轴索引 0→"08:00", 1→"09:00" ...)
        public string[] TimeLabels { get; set; } =
        {
            "08:00", "09:00", "10:00", "11:00", "12:00",
            "13:00", "14:00", "15:00", "16:00", "17:00"
        };

        //  Y 轴数据
        private ObservableCollection<ObservableValue> _values;
        public ObservableCollection<ObservableValue> Values
        {
            get => _values;
            set { _values = value; OnPropertyChanged(); }
        }

        //  Series
        public ISeries[] Series { get; set; }

        //  X 轴:使用 Labels 映射
        public Axis[] XAxes { get; set; }

        //  Y 轴
        public Axis[] YAxes { get; set; }

        //  动态追加演示用 Timer
        private readonly DispatcherTimer _timer;
        private int _nextIndex = 0;
        private readonly Random _rnd = new();

        public ViewModel()
        {
            // 初始化数据(10 个整点对应 10 条数据)
            _values = new ObservableCollection<ObservableValue>();
            for (int i = 0; i < TimeLabels.Length; i++)
                _values.Add(new ObservableValue(_rnd.Next(20, 100)));

            Series = new ISeries[]
            {
                new LineSeries<ObservableValue>
                {
                    Name        = "温度(°C)",
                    Values      = _values,
                    Fill        = new SolidColorPaint(SKColors.SkyBlue.WithAlpha(60)),
                    Stroke      = new SolidColorPaint(SKColors.DodgerBlue, 2),
                    GeometryFill   = new SolidColorPaint(SKColors.White),
                    GeometryStroke = new SolidColorPaint(SKColors.DodgerBlue, 2),
                    GeometrySize   = 8,
                }
            };

            XAxes = new Axis[]
            {
                new Axis
                {
                    Name          = "时间",
                    Labels        = TimeLabels,   // 关键:索引→标签文字
                    LabelsRotation = -30,
                    TextSize      = 11,
                    LabelsPaint   = new SolidColorPaint(SKColors.Gray),
                    NamePaint     = new SolidColorPaint(SKColors.DarkGray),
                    SeparatorsPaint = new SolidColorPaint(SKColors.LightGray)
                                          { StrokeThickness = 1 },
                }
            };

            YAxes = new Axis[]
            {
                new Axis
                {
                    Name      = "数值",
                    TextSize  = 11,
                    LabelsPaint = new SolidColorPaint(SKColors.Gray),
                    NamePaint   = new SolidColorPaint(SKColors.DarkGray),
                    Labeler   = v => $"{v:F1}",
                    SeparatorsPaint = new SolidColorPaint(SKColors.LightGray)
                                          { StrokeThickness = 1 },
                }
            };

            // 每 1.5 秒随机刷新一个数据点(演示动态更新)
            _timer = new DispatcherTimer { Interval = TimeSpan.FromSeconds(1.5) };
            _timer.Tick += (_, _) =>
            {
                _values[_nextIndex] = new ObservableValue(_rnd.Next(20, 100));
                _nextIndex = (_nextIndex + 1) % TimeLabels.Length;
            };
            _timer.Start();
        }

        public event PropertyChangedEventHandler? PropertyChanged;
        protected void OnPropertyChanged([CallerMemberName] string? name = null)
            => PropertyChanged?.Invoke(this, new PropertyChangedEventArgs(name));
    }
}
方式二:使用 Labeler 转换时间戳(适合动态时间序列)
csharp// 数据点的 X 值存储 DateTime.Ticks
public Axis[] XAxes { get; set; } = new[]
{
    new Axis
    {
        Name = "采集时间",
        // 将 Ticks 转回 DateTime 并格式化
        Labeler = value => new DateTime((long)value).ToString("HH:mm:ss"),
        // 最小间距设为 10 秒的 Ticks 数
        MinStep = TimeSpan.FromSeconds(10).Ticks,
        UnitWidth = TimeSpan.FromSeconds(1).Ticks,
        LabelsPaint = new SolidColorPaint(SKColors.DimGray),
        LabelsRotation = -45,
    }
};
踩坑预警: 使用时间戳方式时,MinStep 的单位必须与 X 轴数据的单位一致。如果 X 轴存的是 DateTime.Ticks,那 MinStep 也要用 TimeSpan.FromXxx().Ticks 来计算,直接写一个整数 100 是没有意义的。
🎯 方案二:刻度间距的精确控制
固定间距与强制对齐
csharppublic Axis[] YAxes { get; set; } = new[]
{
    new Axis
    {
        Name = "温度(°C)",
        // 每隔 5°C 一个刻度
        MinStep = 5,
        // 强制严格按 MinStep 生成刻度,不允许自动调整
        ForceStepToMin = true,
        // 配合范围固定,确保刻度从整数开始
        MinLimit = 0,
        MaxLimit = 100,
        LabelsPaint = new SolidColorPaint(SKColors.DarkGray),
        // 自定义网格线:浅灰色虚线
        SeparatorsPaint = new SolidColorPaint(SKColors.LightGray)
        {
            StrokeThickness = 0.8f,
            PathEffect = new DashEffect(new float[] { 4, 4 })
        },
    }
};
ForceStepToMin = true 是一个容易被忽略的属性。不加这个,LiveCharts 2 会把 MinStep 当作"最小间距参考",实际间距可能是它的整数倍。加上之后,刻度严格按照指定间距生成,适合需要精确刻度对齐的场景(比如质量管控图表中的 UCL/LCL 控制线对齐)。
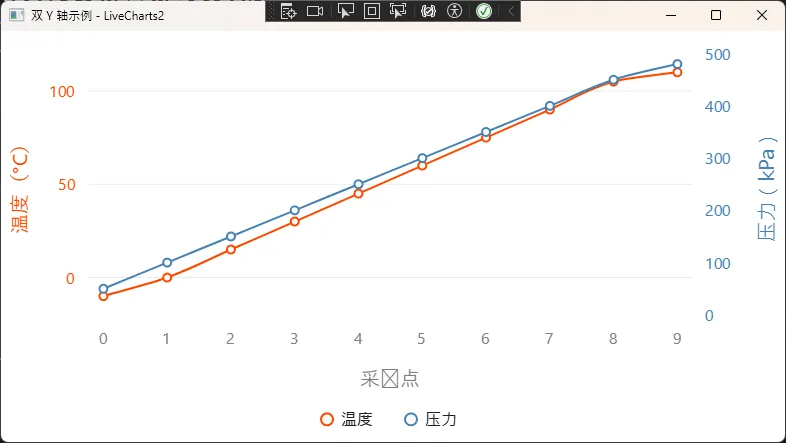
双 Y 轴配置
在需要同时展示量纲差异很大的两组数据时(比如温度和压力),双 Y 轴是标准做法。
csharp// 系列一绑定到第一条 Y 轴(索引 0)
var tempSeries = new LineSeries<double>
{
    Values = temperatureData,
    Name = "温度",
    ScalesYAt = 0, // 绑定到 YAxes[0]
    Fill = null,
    Stroke = new SolidColorPaint(SKColors.OrangeRed) { StrokeThickness = 2 },
};

// 系列二绑定到第二条 Y 轴(索引 1)
var pressureSeries = new LineSeries<double>
{
    Values = pressureData,
    Name = "压力",
    ScalesYAt = 1, // 绑定到 YAxes[1]
    Fill = null,
    Stroke = new SolidColorPaint(SKColors.SteelBlue) { StrokeThickness = 2 },
};

// 两条 Y 轴分别配置
public Axis[] YAxes { get; set; } = new[]
{
    new Axis
    {
        Name = "温度(°C)",
        MinStep = 10,
        MinLimit = -20,
        MaxLimit = 120,
        LabelsPaint = new SolidColorPaint(SKColors.OrangeRed),
        Position = LiveChartsCore.Measure.AxisPosition.Start, // 左侧
    },
    new Axis
    {
        Name = "压力(kPa)",
        MinStep = 50,
        MinLimit = 0,
        MaxLimit = 500,
        LabelsPaint = new SolidColorPaint(SKColors.SteelBlue),
        Position = LiveChartsCore.Measure.AxisPosition.End, // 右侧
        SeparatorsPaint = null, // 第二条 Y 轴不显示网格线,避免视觉混乱
    }
};
⚡ 方案三:范围控制策略——静态与动态的权衡
静态范围:给图表一个稳定的"世界观"
对于展示历史数据、报表类图表,固定范围是最优选择。数据不会变,坐标轴也不该变。
csharppublic Axis[] YAxes { get; set; } = new[]
{
    new Axis
    {
        // 固定范围,图表不会因数据变化而自动缩放
        MinLimit = 0,
        MaxLimit = 100,
        // 加 5% 的视觉边距:实际数据 0~100,轴显示 -5~105
        // 通过 Padding 属性实现
        Padding = new LiveChartsCore.Drawing.Padding(0, 5, 0, 5),
    }
};
踩坑预警: 当数据中存在超出固定范围的异常值时,这些点会被裁剪掉,在图表上消失。如果业务上需要展示异常值,要么动态扩展范围,要么用 Tooltip 标注,不能简单地固定范围了事。
动态范围:实时数据下的平衡策略
完全自动范围会抖动,完全固定范围不适应数据变化。实际项目中,一个折中方案是固定下限、动态调整上限,或者基于滑动窗口的数据统计来设置范围。
csharpusing CommunityToolkit.Mvvm.ComponentModel;
using LiveChartsCore;
using LiveChartsCore.Defaults;
using LiveChartsCore.SkiaSharpView;
using LiveChartsCore.SkiaSharpView.Painting;
using SkiaSharp;
using System;
using System.Collections.Generic;
using System.Collections.ObjectModel;
using System.Linq;
using System.Threading;
using System.Threading.Tasks;
using System.Windows;

namespace AppLiveChart10
{
    public partial class MainViewModel : ObservableObject, IDisposable
    {
        //  滑动窗口容量
        private const int WindowSize = 100;

        //  范围触发阈值:只有数据超出当前范围的 5% 才重新计算
        private const double ReboundThreshold = 0.05;

        private readonly ObservableCollection<ObservablePoint> _liveData = new();
        private CancellationTokenSource _cts = new();

        // 记录上一次设置的范围,用于抖动抑制
        private double _lastMin = double.NaN;
        private double _lastMax = double.NaN;

        //  公开给 View 绑定的属性
        public ISeries[] Series { get; }
        public Axis[] XAxes { get; }
        public Axis[] YAxes { get; }

        public MainViewModel()
        {
            // 折线系列
            Series = new ISeries[]
            {
                new LineSeries<ObservablePoint>
                {
                    Values            = _liveData,
                    Name              = "实时数据",
                    Stroke            = new SolidColorPaint(SKColors.DodgerBlue, 2),
                    Fill              = new SolidColorPaint(SKColors.DodgerBlue.WithAlpha(30)),
                    GeometrySize      = 0,          // 不绘制数据点标记,提升性能
                    GeometryStroke    = null,
                    GeometryFill      = null,
                    LineSmoothness    = 0.3,
                }
            };

            // X 轴:只显示最新 WindowSize 个点
            XAxes = new Axis[]
            {
                new Axis
                {
                    Name         = "采样序号",
                    NamePaint    = new SolidColorPaint(SKColors.Gray),
                    LabelsPaint  = new SolidColorPaint(SKColors.Gray),
                    MinLimit     = 0,
                    MaxLimit     = WindowSize,
                    IsVisible    = true,
                }
            };

            // Y 轴:初始范围,后续由 UpdateChartRange() 动态维护
            YAxes = new Axis[]
            {
                new Axis
                {
                    Name        = "数值",
                    NamePaint   = new SolidColorPaint(SKColors.Gray),
                    LabelsPaint = new SolidColorPaint(SKColors.Gray),
                    MinLimit    = 0,
                    MaxLimit    = 100,
                }
            };

            // 启动后台数据生成任务
            _ = StartDataFeedAsync(_cts.Token);
        }

        //  后台数据生成(模拟传感器)
        private async Task StartDataFeedAsync(CancellationToken token)
        {
            var rng = new Random(42);
            double val = 50.0;
            int idx = 0;

            while (!token.IsCancellationRequested)
            {
                // 模拟带漂移的随机游走信号
                val += (rng.NextDouble() - 0.48) * 4.0;
                val = Math.Clamp(val, 0, 200);   // 防止无限漂移

                await Application.Current.Dispatcher.InvokeAsync(() =>
                {
                    _liveData.Add(new ObservablePoint(idx, val));

                    // 维护滑动窗口
                    if (_liveData.Count > WindowSize)
                        _liveData.RemoveAt(0);

                    // 同步滚动 X 轴窗口
                    if (idx >= WindowSize)
                    {
                        XAxes[0].MinLimit = idx - WindowSize + 1;
                        XAxes[0].MaxLimit = idx + 1;
                    }

                    UpdateChartRange();
                    idx++;
                });

                await Task.Delay(50, token);   // 约 20 FPS
            }
        }

        //  核心:抖动抑制的动态范围策略
        private void UpdateChartRange()
        {
            if (_liveData.Count == 0) return;

            double dataMax = _liveData.Max(p => p.Y ?? 0);
            double dataMin = _liveData.Min(p => p.Y ?? 0);
            double range = dataMax - dataMin;

            // 极端情况保护:数据全部相同时给一个最小视觉范围
            if (range < 1e-6) range = 1.0;

            // 上下各留 10% 视觉边距
            double margin = range * 0.1;
            double targetMin = Math.Floor(dataMin - margin);
            double targetMax = Math.Ceiling(dataMax + margin);

            //  抖动抑制:只有超出当前范围一定比例才更新
            bool needUpdate = double.IsNaN(_lastMin) || double.IsNaN(_lastMax);

            if (!needUpdate)
            {
                double currentRange = _lastMax - _lastMin;
                double overflowRatio = Math.Max(
                    (_lastMin - targetMin) / currentRange,   // 下溢
                    (targetMax - _lastMax) / currentRange    // 上溢
                );
                needUpdate = overflowRatio > ReboundThreshold;
            }

            if (needUpdate)
            {
                YAxes[0].MinLimit = targetMin;
                YAxes[0].MaxLimit = targetMax;
                _lastMin = targetMin;
                _lastMax = targetMax;
            }
        }

        //  释放资源
        public void Dispose()
        {
            _cts.Cancel();
            _cts.Dispose();
        }
    }
}
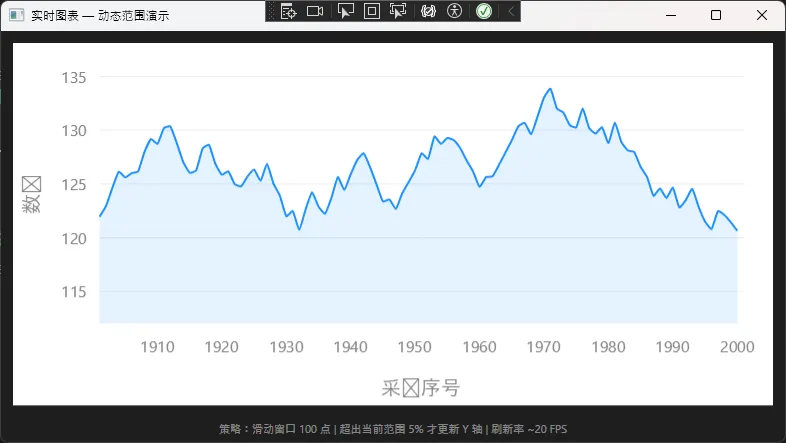
这个方案在数据波动稳定时,范围基本不变;只有当数据突破当前边界时才重新计算,视觉上的抖动大幅减少。
性能对比
| 范围策略 | 适用场景 | UI 抖动 | CPU 开销 |
|---|---|---|---|
| 完全自动(默认) | 静态数据探索 | 高 | 低 |
| 完全固定 | 报表、历史数据 | 无 | 最低 |
| 动态边距计算 | 实时监控 | 低 | 中 |
| 滑动窗口统计 | 高频实时数据 | 极低 | 中高 |
测试环境:i5-1240P,16GB DDR4,.NET 8,Windows 11 23H2,数据刷新频率 10Hz,数据点数 500
🛠 常见问题与解决方案
Q:标签旋转后被裁剪,显示不完整?
增加图表的 DrawMargin 给坐标轴留出更多空间:
csharpChart.DrawMarginFrame = new DrawMarginFrame
{
    Fill = new SolidColorPaint(SKColors.White),
    Stroke = new SolidColorPaint(SKColors.LightGray) { StrokeThickness = 1 }
};
// 或者直接设置边距
Chart.DrawMargin = new LiveChartsCore.Measure.Margin(40, 10, 60, 50);
// 参数顺序:Left, Top, Right, Bottom
Q:Y 轴标签与轴线重叠?
调整 NamePadding 属性:
csharpnew Axis
{
    Name = "数值",
    NamePadding = new LiveChartsCore.Drawing.Padding(0, 0, 15, 0),
}
Q:刻度线不显示?
默认 TicksPaint 为 null,需要显式设置:
csharpnew Axis
{
    TicksPaint = new SolidColorPaint(SKColors.Gray) { StrokeThickness = 1.5f },
    TicksAtCenter = true, // 刻度居中对齐到标签
}
💡 三句话技术洞察
- 坐标轴的本质是数据到像素的映射规则——所有配置问题,归根结底都是在定义这个映射的边界、密度和表达方式。
MinStep的单位跟随数据单位,时间序列用 Ticks,数值序列用原始量级,这个对齐关系搞错了,刻度配置必然失控。- 固定范围不是保守,而是对业务语义的明确表达——当你知道数据的合理区间时,固定范围比自动计算更诚实。
💬 互动话题
话题一: 在你的项目里,坐标轴的标签格式化有没有遇到过特别棘手的需求?比如多语言数字格式、非线性刻度(对数轴)等,最终是怎么解决的?
话题二: 双 Y 轴在实际使用中争议不小——有人认为它让图表信息密度更高,也有人认为它增加了读图负担。在你的业务场景里,双 Y 轴是必要的设计还是可以避免的复杂度?
欢迎在评论区分享你的实践经验,或者把踩过的坑写出来,对同样在摸索这个库的开发者会很有帮助。
📚 持续学习路径
坐标轴配置掌握之后,建议按以下方向继续深入:
- LiveCharts 2 自定义几何图形 — 实现非标准的数据点形状与标注样式
- SkiaSharp 绘图基础 — 理解
IPaint体系,解锁更复杂的视觉效果 - MVVM 数据绑定模式 — 将图表配置与业务逻辑彻底解耦,提升可维护性
- WPF 性能优化 — 虚拟化、渲染层优化,在大数据量场景下保持流畅
标签: C# WPF LiveCharts2 数据可视化 坐标轴配置 C#开发 编程技巧
相关信息
我用夸克网盘给你分享了「AppLiveChart08.zip」,点击链接或复制整段内容,打开「夸克APP」即可获取。
/0c013YNjhe:/
链接:https://pan.quark.cn/s/ec0bd71d2dcd
提取码:tg2i
本文作者:技术老小子
本文链接:
版权声明:本博客所有文章除特别声明外,均采用 BY-NC-SA 许可协议。转载请注明出处!