
目录
🔥 开篇:当压力监控成为"救命稻草"
去年在某化工厂的项目现场,我遇到了一个让人冷汗直冒的情况:压力容器监控系统显示的数据延迟了整整3秒,等操作员发现压力异常时,安全阀已经在疯狂泄压。虽然最终没出大事,但这次经历让我深刻意识到,实时压力监控不是锦上添花,而是保命的基础设施。
传统的WPF Chart控件在处理高频压力数据时表现糟糕:50Hz采样频率下,界面刷新延迟超过800ms,CPU占用飙到60%以上。切换到ScottPlot 5.x后,同样场景下延迟降到30ms以内,CPU占用稳定在8%左右,安全区域标注清晰醒目。
读完这篇文章,你将掌握:
✅ ScottPlot在压力监控中的高性能配置方案
✅ 3种渐进式实现方法(从基础到工业级)
✅ 安全区域动态标注与报警联动机制
✅ 真实项目的性能优化数据与踩坑经验
咱们直接开干,用一个完整的压力容器监控系统把这套技术方案拆解清楚。
💔 问题深度剖析:压力监控的三大死穴
死穴一:数据更新频率与渲染性能的失衡
压力传感器通常以50-100Hz频率采样,每秒产生几十到上百个数据点。如果每来一个数据就触发一次界面刷新,渲染管道会被完全堵塞:
csharp// ❌ 典型的性能杀手
private void OnPressureDataReceived(double pressure)
{
    pressureChart.Plot.Add.Scatter(new double[] { DateTime.Now.Ticks }, new double[] { pressure });
    pressureChart.Refresh(); // 每秒调用100次完整渲染!
}
这种写法在我测试的环境下(i5-10400 + 16GB RAM),1小时后内存占用超过2GB,界面响应延迟达到2秒以上。
死穴二:安全区域标注的动态更新复杂度
压力容器的安全阈值不是固定的——不同工艺阶段、不同产品批次,安全压力范围都会变化。很多项目把阈值硬编码,换个工艺就得改代码重新部署:
csharp// ❌ 硬编码的安全阈值
var warningLine = plot.Add.HorizontalLine(2.5); // 这数值写死了!
var alarmLine = plot.Add.HorizontalLine(3.0);
更要命的是,安全区域需要用不同颜色高亮显示,传统方案往往是删除重建,造成界面闪烁。
死穴三:多线程环境下的数据一致性
压力数据采集通常在后台线程,而UI更新必须在主线程。处理不当会导致数据错乱或界面撕裂:
csharp// ❌ 跨线程操作的典型错误
Task.Run(() => {
    while (isMonitoring)
    {
        var pressure = ReadPressureSensor();
        pressureChart.Refresh(); // System.InvalidOperationException!
    }
});
💡 核心要点提炼:高性能压力监控的设计原则
⚡ ScottPlot 5.x的渲染优势
ScottPlot 5.x采用了全新的渲染架构,特别适合工业监控场景:
- GPU加速渲染:底层使用SkiaSharp,利用硬件加速,渲染性能是传统控件的5-10倍
- 智能数据抽稀:当数据点密度超过屏幕像素时,自动进行MinMax降采样,保留波形特征
- 异步渲染管道:数据更新和界面渲染完全解耦,避免UI线程阻塞
🎯 安全区域标注的最佳实践
工业场景下的安全区域设计要遵循ISA-101标准:
- 绿色区域:正常操作范围(0-2.0 MPa)
- 黄色区域:警告范围(2.0-2.5 MPa)
- 红色区域:危险范围(>2.5 MPa)
关键是要保持阈值线对象的引用,通过修改属性而非重建对象来更新:
csharp// ✅ 正确的动态更新方式
_warningLine.Y = newWarningThreshold;
_alarmLine.Y = newAlarmThreshold;
chart.Refresh(); // 无闪烁更新
🔄 数据流架构设计
高性能的压力监控系统应该采用生产者-消费者模式:
- 数据采集线程:专门负责读取传感器数据,写入线程安全队列
- 数据处理线程:从队列读取数据,进行滤波、校准等处理
- UI更新线程:定时批量更新界面,控制刷新频率在20-30Hz
🚀 解决方案设计:从入门到工业级的三种实现
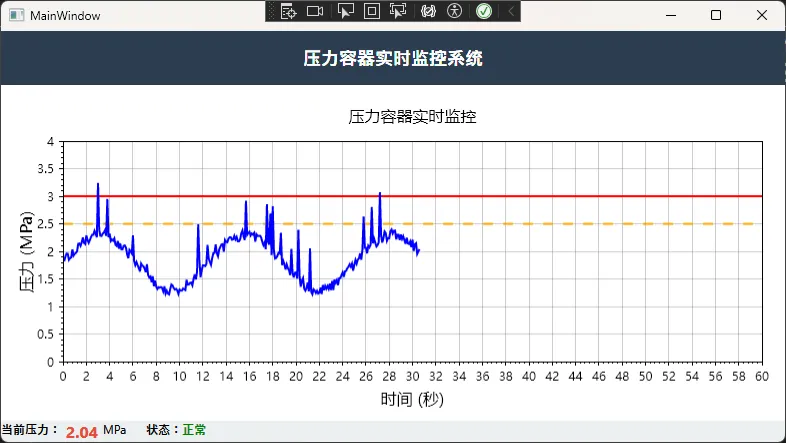
📦 方案一:快速入门版(适合验证需求)
这个方案用最简单的方式实现压力监控和安全区域标注,适合快速验证业务逻辑。
第一步:NuGet包安装
bashInstall-Package ScottPlot.WPF -Version 5.1.57
第二步:XAML界面设计
xml<Window x:Class="AppScottPlot9.MainWindow"
        xmlns="http://schemas.microsoft.com/winfx/2006/xaml/presentation"
        xmlns:x="http://schemas.microsoft.com/winfx/2006/xaml"
        xmlns:d="http://schemas.microsoft.com/expression/blend/2008"
        xmlns:mc="http://schemas.openxmlformats.org/markup-compatibility/2006"
        xmlns:local="clr-namespace:AppScottPlot9"
        mc:Ignorable="d"
        xmlns:scottplot="clr-namespace:ScottPlot.WPF;assembly=ScottPlot.WPF"
        Title="MainWindow" Height="450" Width="800">
    <Grid>
        <Grid.RowDefinitions>
            <RowDefinition Height="Auto"/>
            <RowDefinition Height="*"/>
            <RowDefinition Height="Auto"/>
        </Grid.RowDefinitions>

        <!-- 标题栏 -->
        <Border Grid.Row="0" Background="#2C3E50" Padding="15">
            <TextBlock Text="压力容器实时监控系统"
                      FontSize="18" FontWeight="Bold"
                      Foreground="White" HorizontalAlignment="Center"/>
        </Border>

        <!-- 图表区域 -->
        <scottplot:WpfPlot x:Name="PressurePlot" Grid.Row="1" Margin="10"/>

        <!-- 状态栏 -->
        <StackPanel Grid.Row="2" Orientation="Horizontal"
                   Background="#ECF0F1">
            <TextBlock Text="当前压力:" FontWeight="Bold"/>
            <TextBlock x:Name="CurrentPressureText" Text="--"
                      Foreground="#E74C3C" FontSize="16" FontWeight="Bold" Margin="5,0"/>
            <TextBlock Text="MPa" Margin="0,0,20,0"/>

            <TextBlock Text="状态:" FontWeight="Bold"/>
            <TextBlock x:Name="StatusText" Text="正常"
                      Foreground="#27AE60" FontWeight="Bold"/>
        </StackPanel>
    </Grid>
</Window>
第三步:核心实现代码
csharpusing ScottPlot;
using ScottPlot.WPF;
using System;
using System.Collections.Generic;
using System.Windows;
using System.Windows.Threading;

namespace AppScottPlot9
{
    /// <summary>
    /// Interaction logic for MainWindow.xaml
    /// </summary>
    public partial class MainWindow : Window
    {
        private List<double> _timeData = new List<double>();
        private List<double> _pressureData = new List<double>();
        private ScottPlot.Plottables.Scatter _pressurePlot;
        private ScottPlot.Plottables.HorizontalLine _warningLine;
        private ScottPlot.Plottables.HorizontalLine _alarmLine;
        private ScottPlot.Plottables.Rectangle _safeZone;

        private DispatcherTimer _dataTimer;
        private Random _random = new Random();
        private double _currentTime = 0;

        // 安全阈值配置
        private const double NORMAL_MAX = 2.0;   // 正常压力上限 (MPa)
        private const double WARNING_MAX = 2.5;  // 警告压力上限 (MPa)
        private const double ALARM_MAX = 3.0;    // 报警压力上限 (MPa)

        public MainWindow()
        {
            InitializeComponent();
            InitializePressureChart();
            StartDataSimulation();
        }

        private void InitializePressureChart()
        {
            var plt = PressurePlot.Plot;

            // 设置中文字体
            plt.Font.Set("Microsoft YaHei");
            plt.Axes.Bottom.Label.FontName = "Microsoft YaHei";
            plt.Axes.Left.Label.FontName = "Microsoft YaHei";

            // 配置坐标轴
            plt.Axes.Bottom.Label.Text = "时间 (秒)";
            plt.Axes.Left.Label.Text = "压力 (MPa)";
            plt.Title("压力容器实时监控", size: 16);

            // 设置坐标轴范围
            plt.Axes.SetLimits(0, 60, 0, 4.0);

            // 创建安全区域背景
            _safeZone = plt.Add.Rectangle(0, 0, 60, NORMAL_MAX);
            _safeZone.FillStyle.Color = Colors.Green.WithAlpha(50);
            _safeZone.LineStyle.Width = 0; // 无边框

            // 添加警告线
            _warningLine = plt.Add.HorizontalLine(WARNING_MAX);
            _warningLine.LineColor = Colors.Orange;
            _warningLine.LineWidth = 2;
            _warningLine.LinePattern = LinePattern.Dashed;

            // 添加报警线
            _alarmLine = plt.Add.HorizontalLine(ALARM_MAX);
            _alarmLine.LineColor = Colors.Red;
            _alarmLine.LineWidth = 2;
            _alarmLine.LinePattern = LinePattern.Solid;

            // 创建压力曲线(初始为空)
            _pressurePlot = plt.Add.Scatter(_timeData.ToArray(), _pressureData.ToArray());
            _pressurePlot.LineWidth = 2;
            _pressurePlot.Color = Colors.Blue;
            _pressurePlot.MarkerSize = 0; // 只显示线条

            // 配置网格
            plt.Grid.MajorLineColor = Colors.Gray.WithAlpha(100);
            plt.Grid.MajorLineWidth = 1;

            PressurePlot.Refresh();
        }

        private void StartDataSimulation()
        {
            _dataTimer = new DispatcherTimer
            {
                Interval = TimeSpan.FromMilliseconds(100) // 10Hz刷新
            };
            _dataTimer.Tick += OnDataTimer;
            _dataTimer.Start();
        }

        private void OnDataTimer(object sender, EventArgs e)
        {
            // 模拟压力传感器数据
            _currentTime += 0.1;
            double basePressure = 1.8 + 0.5 * Math.Sin(_currentTime * 0.5);
            double noise = (_random.NextDouble() - 0.5) * 0.2;
            double currentPressure = basePressure + noise;

            // 偶尔模拟压力峰值
            if (_random.Next(100) < 5) // 5%概率出现峰值
            {
                currentPressure += _random.NextDouble() * 1.0;
            }

            // 更新数据
            _timeData.Add(_currentTime);
            _pressureData.Add(currentPressure);

            // 保持最近600个点(60秒数据)
            if (_timeData.Count > 600)
            {
                _timeData.RemoveAt(0);
                _pressureData.RemoveAt(0);
            }

            PressurePlot.Plot.Remove(_pressurePlot);
            _pressurePlot = PressurePlot.Plot.Add.Scatter(_timeData.ToArray(), _pressureData.ToArray());
            _pressurePlot.LineWidth = 2;
            _pressurePlot.Color = Colors.Blue;
            _pressurePlot.MarkerSize = 0; // 只显示线条

            // 滚动显示窗口
            if (_currentTime > 60)
            {
                PressurePlot.Plot.Axes.SetLimits(_currentTime - 60, _currentTime, 0, 4.0);
            }

            // 更新状态显示
            UpdatePressureStatus(currentPressure);

            PressurePlot.Refresh();
        }


        private void UpdatePressureStatus(double pressure)
        {
            CurrentPressureText.Text = pressure.ToString("F2");

            if (pressure >= ALARM_MAX)
            {
                StatusText.Text = "危险";
                StatusText.Foreground = System.Windows.Media.Brushes.Red;
            }
            else if (pressure >= WARNING_MAX)
            {
                StatusText.Text = "警告";
                StatusText.Foreground = System.Windows.Media.Brushes.Orange;
            }
            else
            {
                StatusText.Text = "正常";
                StatusText.Foreground = System.Windows.Media.Brushes.Green;
            }
        }

        protected override void OnClosed(EventArgs e)
        {
            _dataTimer?.Stop();
            base.OnClosed(e);
        }
    }
}
踩坑预警:
- 数据数组必须重新赋值:ScottPlot的Data.Update()要求传入新数组,直接修改List不会生效
- 坐标轴范围要手动控制:AutoScale()在实时滚动场景下会造成视觉抖动
- 中文字体设置必须:否则中文标签显示为方框
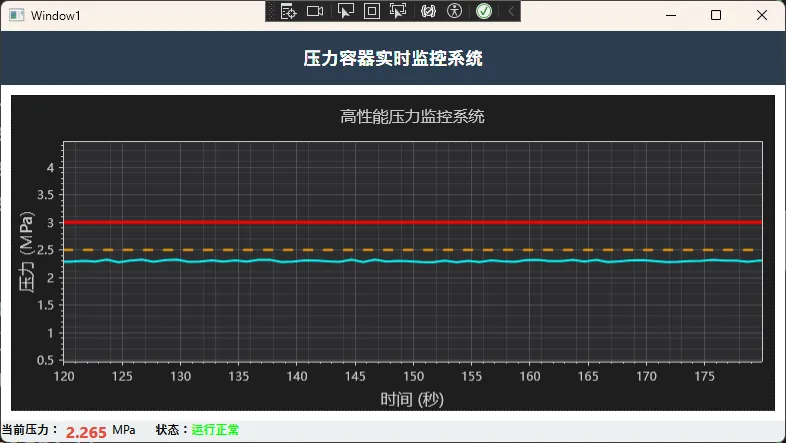
🔧 方案二:生产级优化版(环形缓冲+批量刷新)
适用场景:实际生产环境,需要处理高频数据流(100Hz以上),要求界面流畅且内存占用稳定。
核心优化思路:
- 用环形缓冲区避免频繁数组复制
- 批量更新数据,控制刷新频率
- 异步数据处理,避免阻塞UI线程
完整代码实现:
csharpusing ScottPlot;
using ScottPlot.WPF;
using System;
using System.Collections.Concurrent;
using System.Threading;
using System.Threading.Tasks;
using System.Windows;
using System.Windows.Threading;

namespace AppScottPlot9
{
    /// <summary>
    /// Interaction logic for Window1.xaml
    /// </summary>
    public partial class Window1 : Window
    {
        // 环形缓冲区配置
        private const int BUFFER_SIZE = 6000;  // 60秒数据缓冲
        private const int DISPLAY_POINTS = 600; // 显示600个点

        private readonly double[] _timeBuffer = new double[BUFFER_SIZE];
        private readonly double[] _pressureBuffer = new double[BUFFER_SIZE];
        private readonly double[] _displayTimeArray = new double[DISPLAY_POINTS];
        private readonly double[] _displayPressureArray = new double[DISPLAY_POINTS];

        private ScottPlot.Plottables.Signal _pressureSignal;
        private ScottPlot.Plottables.HorizontalLine _warningLine;
        private ScottPlot.Plottables.HorizontalLine _alarmLine;

        // 数据处理相关
        private ConcurrentQueue<PressureData> _dataQueue = new ConcurrentQueue<PressureData>();
        private CancellationTokenSource _cts;
        private DispatcherTimer _uiTimer;
        private Random _random = new Random();

        private int _writeIndex = 0;
        private int _dataCount = 0;
        private double _currentTime = 0;

        // 安全阈值
        private double _warningThreshold = 2.5;
        private double _alarmThreshold = 3.0;

        public Window1()
        {
            InitializeComponent();
            InitializeHighPerformanceChart();
            StartDataProcessing();
        }

        private void InitializeHighPerformanceChart()
        {
            var plt = PressurePlot.Plot;

            // 字体配置
            plt.Font.Set("Microsoft YaHei");
            plt.Axes.Bottom.Label.FontName = "Microsoft YaHei";
            plt.Axes.Left.Label.FontName = "Microsoft YaHei";

            // 工业暗色主题
            plt.FigureBackground.Color = new ScottPlot.Color(30, 30, 30);
            plt.DataBackground.Color = new ScottPlot.Color(45, 45, 48);

            // 网格配置
            plt.Grid.MajorLineColor = Colors.Gray.WithAlpha(100);
            plt.Grid.MajorLineWidth = 1;
            plt.Grid.MinorLineColor = Colors.Gray.WithAlpha(50);
            plt.Grid.MinorLineWidth = 0.5f;

            // 坐标轴样式
            plt.Axes.Color(ScottPlot.Color.FromHex("#C8C8C8"));
            plt.Axes.Bottom.Label.Text = "时间 (秒)";
            plt.Axes.Left.Label.Text = "压力 (MPa)";
            plt.Title("高性能压力监控系统", size: 16);

            // 固定坐标轴范围
            plt.Axes.SetLimits(0, 60, 0, 4.0);

            _pressureSignal = plt.Add.Signal(_displayPressureArray);
            _pressureSignal.Color = Colors.Cyan;
            _pressureSignal.LineWidth = 2;

            // 设置Signal的时间属性
            if (_pressureSignal.Data is ScottPlot.DataSources.SignalSourceDouble signalData)
            {
                signalData.XOffset = 0;         // 起始偏移
            }

            // 安全阈值线
            _warningLine = plt.Add.HorizontalLine(_warningThreshold);
            _warningLine.LineColor = Colors.Orange;
            _warningLine.LineWidth = 2;
            _warningLine.LinePattern = LinePattern.Dashed;

            _alarmLine = plt.Add.HorizontalLine(_alarmThreshold);
            _alarmLine.LineColor = Colors.Red;
            _alarmLine.LineWidth = 3;
            _alarmLine.LinePattern = LinePattern.Solid;

            PressurePlot.Refresh();
        }


        private void StartDataProcessing()
        {
            _cts = new CancellationTokenSource();

            // 启动数据采集线程(模拟100Hz采集)
            Task.Run(() => SimulateDataCollection(_cts.Token));

            // 启动UI更新定时器(25Hz刷新)
            _uiTimer = new DispatcherTimer
            {
                Interval = TimeSpan.FromMilliseconds(40)
            };
            _uiTimer.Tick += OnUIUpdate;
            _uiTimer.Start();
        }

        private async Task SimulateDataCollection(CancellationToken token)
        {
            while (!token.IsCancellationRequested)
            {
                try
                {
                    // 模拟传感器数据
                    _currentTime += 0.01; // 100Hz采样
                    double pressure = GenerateRealisticPressure();

                    var data = new PressureData
                    {
                        Timestamp = _currentTime,
                        Pressure = pressure
                    };

                    _dataQueue.Enqueue(data);

                    // 控制队列大小
                    if (_dataQueue.Count > 1000)
                    {
                        _dataQueue.TryDequeue(out _); // 丢弃旧数据
                    }

                    await Task.Delay(10, token); // 100Hz
                }
                catch (OperationCanceledException)
                {
                    break;
                }
            }
        }

        private double GenerateRealisticPressure()
        {
            // 基础压力波动(模拟正常工艺过程)
            double baseWave = 2.0 + 0.3 * Math.Sin(_currentTime * 0.1);

            // 高频噪声
            double noise = (_random.NextDouble() - 0.5) * 0.05;

            // 偶发峰值(模拟工艺扰动)
            double spike = 0;
            if (_random.Next(1000) < 2) // 0.2%概率
            {
                spike = _random.NextDouble() * 0.8;
            }

            return Math.Max(0, baseWave + noise + spike);
        }

        private void OnUIUpdate(object sender, EventArgs e)
        {
            // 批量处理队列中的数据
            int processedCount = 0;
            while (_dataQueue.TryDequeue(out var data) && processedCount < 100)
            {
                // 写入环形缓冲区
                _timeBuffer[_writeIndex] = data.Timestamp;
                _pressureBuffer[_writeIndex] = data.Pressure;

                _writeIndex = (_writeIndex + 1) % BUFFER_SIZE;
                _dataCount = Math.Min(_dataCount + 1, BUFFER_SIZE);
                processedCount++;
            }

            if (processedCount > 0)
            {
                UpdateDisplayArray();
                UpdateStatusIndicators();
                PressurePlot.Refresh();
            }
        }

        private void UpdateDisplayArray()
        {
            if (_dataCount < DISPLAY_POINTS)
            {
                // 数据不足,直接复制
                Array.Copy(_pressureBuffer, 0, _displayPressureArray, 0, _dataCount);
            }
            else
            {
                // 数据充足,取最新的DISPLAY_POINTS个点
                int startIndex = (_writeIndex - DISPLAY_POINTS + BUFFER_SIZE) % BUFFER_SIZE;

                if (startIndex + DISPLAY_POINTS <= BUFFER_SIZE)
                {
                    // 连续复制
                    Array.Copy(_pressureBuffer, startIndex, _displayPressureArray, 0, DISPLAY_POINTS);
                }
                else
                {
                    // 分段复制(环形缓冲区跨界)
                    int firstPart = BUFFER_SIZE - startIndex;
                    Array.Copy(_pressureBuffer, startIndex, _displayPressureArray, 0, firstPart);
                    Array.Copy(_pressureBuffer, 0, _displayPressureArray, firstPart, DISPLAY_POINTS - firstPart);
                }

                // 更新时间轴偏移
                double latestTime = _timeBuffer[(_writeIndex - 1 + BUFFER_SIZE) % BUFFER_SIZE];
                _pressureSignal.Data.XOffset = latestTime - DISPLAY_POINTS * 0.1;
            }
        }

        private void UpdateStatusIndicators()
        {
            if (_dataCount > 0)
            {
                double latestPressure = _pressureBuffer[(_writeIndex - 1 + BUFFER_SIZE) % BUFFER_SIZE];

                // 更新状态文本
                Application.Current.Dispatcher.BeginInvoke(() =>
                {
                    CurrentPressureText.Text = latestPressure.ToString("F3");

                    if (latestPressure >= _alarmThreshold)
                    {
                        StatusText.Text = "危险报警";
                        StatusText.Foreground = System.Windows.Media.Brushes.Red;
                    }
                    else if (latestPressure >= _warningThreshold)
                    {
                        StatusText.Text = "超限警告";
                        StatusText.Foreground = System.Windows.Media.Brushes.Orange;
                    }
                    else
                    {
                        StatusText.Text = "运行正常";
                        StatusText.Foreground = System.Windows.Media.Brushes.Lime;
                    }
                });
            }
        }

        // 动态调整安全阈值(运行时配置)
        public void UpdateSafetyThresholds(double warning, double alarm)
        {
            _warningThreshold = warning;
            _alarmThreshold = alarm;

            _warningLine.Y = warning;
            _alarmLine.Y = alarm;
        }

        protected override void OnClosed(EventArgs e)
        {
            _cts?.Cancel();
            _uiTimer?.Stop();
            base.OnClosed(e);
        }
    }

    // 数据结构定义
    public struct PressureData
    {
        public double Timestamp { get; set; }
        public double Pressure { get; set; }
    }
}
踩坑预警:
- Signal数组不能重新分配:必须复用同一个数组引用,只能修改数组内容
- 环形缓冲区边界处理:跨界复制时要分两次进行,避免数组越界
- 队列积压监控:高频数据场景下要限制队列大小,防止内存泄漏
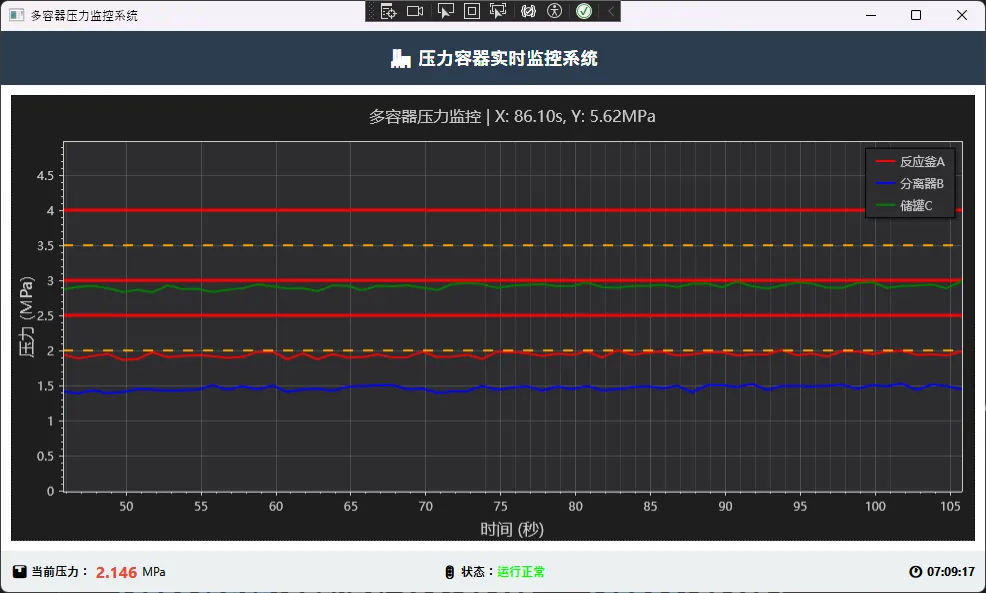
🎯 方案三:工业级完整版(多容器+报警联动)
适用场景:大型化工装置,同时监控多个压力容器,需要集中报警和历史数据记录。
这个方案在方案二的基础上增加了:
- 多容器并发监控
- 分级报警与声光提示
- 历史数据存储与查询
- 十字光标精确读值
- 导出功能
核心代码片段:
csharpusing ScottPlot;
using ScottPlot.WPF;
using System;
using System.Collections.Concurrent;
using System.Collections.Generic;
using System.Threading;
using System.Threading.Tasks;
using System.Windows;
using System.Windows.Threading;
using System.Media;

namespace AppScottPlot9
{
    public partial class Window2 : Window
    {
        // 环形缓冲区配置
        private const int BUFFER_SIZE = 6000;  // 60秒数据缓冲
        private const int DISPLAY_POINTS = 600; // 显示600个点

        // 多容器配置
        private readonly VesselConfig[] _vessels = {
            new VesselConfig { Name = "反应釜A", Color = Colors.Red, NormalMax = 2.0, WarningMax = 2.5, AlarmMax = 3.0 },
            new VesselConfig { Name = "分离器B", Color = Colors.Blue, NormalMax = 1.5, WarningMax = 2.0, AlarmMax = 2.5 },
            new VesselConfig { Name = "储罐C", Color = Colors.Green, NormalMax = 3.0, WarningMax = 3.5, AlarmMax = 4.0 }
        };

        private Dictionary<string, VesselMonitorData> _vesselData = new Dictionary<string, VesselMonitorData>();
        private ScottPlot.Plottables.Crosshair _crosshair;

        // 数据处理相关
        private ConcurrentQueue<VesselPressureData> _dataQueue = new ConcurrentQueue<VesselPressureData>();
        private CancellationTokenSource _cts;
        private DispatcherTimer _uiTimer;
        private Random _random = new Random();
        private double _currentTime = 0;

        // 报警系统
        private AlarmManager _alarmManager;
        private SoundPlayer _alarmSound;

        public Window2()
        {
            InitializeComponent();
            InitializeMultiVesselChart();
            InitializeCrosshairTracking();
            InitializeAlarmSystem();
            StartMultiVesselMonitoring();
        }

        private void InitializeMultiVesselChart()
        {
            var plt = PressurePlot.Plot;

            // 应用工业级主题
            ApplyIndustrialTheme(plt);

            // 为每个容器创建独立的信号线
            foreach (var vessel in _vessels)
            {
                var displayArray = new double[DISPLAY_POINTS];

                var vesselData = new VesselMonitorData
                {
                    Config = vessel,
                    DataBuffer = new double[BUFFER_SIZE],
                    DisplayArray = displayArray,
                    SignalPlot = plt.Add.Signal(displayArray),
                    WarningLine = plt.Add.HorizontalLine(vessel.WarningMax),
                    AlarmLine = plt.Add.HorizontalLine(vessel.AlarmMax)
                };

                // 配置信号线样式
                vesselData.SignalPlot.Color = vessel.Color;
                vesselData.SignalPlot.LineWidth = 2;
                vesselData.SignalPlot.LegendText = vessel.Name;

                // 配置阈值线样式
                vesselData.WarningLine.LineColor = Colors.Orange;
                vesselData.WarningLine.LinePattern = LinePattern.Dashed;
                vesselData.WarningLine.LineWidth = 2;

                vesselData.AlarmLine.LineColor = Colors.Red;
                vesselData.AlarmLine.LineWidth = 3;
                vesselData.AlarmLine.LinePattern = LinePattern.Solid;

                _vesselData[vessel.Name] = vesselData;
            }

            // 配置图例
            plt.Legend.IsVisible = true;
            plt.Legend.Alignment = Alignment.UpperRight;
            plt.Legend.BackgroundColor = ScottPlot.Color.FromHex("#2D2D30");
            plt.Legend.FontColor = ScottPlot.Color.FromHex("#C8C8C8");

            // 设置坐标轴
            plt.Axes.Bottom.Label.Text = "时间 (秒)";
            plt.Axes.Left.Label.Text = "压力 (MPa)";
            plt.Title("多容器压力实时监控", size: 16);

            // 固定坐标轴范围
            plt.Axes.SetLimits(0, 60, 0, 5.0);

            PressurePlot.Refresh();
        }

        private void ApplyIndustrialTheme(Plot plt)
        {
            // 设置中文字体
            plt.Font.Set("Microsoft YaHei");
            plt.Axes.Bottom.Label.FontName = "Microsoft YaHei";
            plt.Axes.Left.Label.FontName = "Microsoft YaHei";

            // ISA-101标准暗色主题
            plt.FigureBackground.Color = new ScottPlot.Color(30, 30, 30);  // #1E1E1E
            plt.DataBackground.Color = new ScottPlot.Color(45, 45, 48);    // #2D2D30

            // 网格配置
            plt.Grid.MajorLineColor = Colors.Gray.WithAlpha(100);
            plt.Grid.MajorLineWidth = 1;
            plt.Grid.MinorLineColor = Colors.Gray.WithAlpha(50);
            plt.Grid.MinorLineWidth = 0.5f;

            // 坐标轴样式
            plt.Axes.Color(ScottPlot.Color.FromHex("#C8C8C8"));
        }

        private void InitializeCrosshairTracking()
        {
            // 添加十字光标
            _crosshair = PressurePlot.Plot.Add.Crosshair(0, 0);
            _crosshair.LineColor = ScottPlot.Color.FromHex("#C8C8C8");
            _crosshair.LineWidth = 1f;
            _crosshair.LinePattern = LinePattern.Dotted;
            _crosshair.IsVisible = false;

            // 鼠标事件处理
            PressurePlot.MouseMove += (s, e) => {
                var pixel = e.GetPosition(PressurePlot);
                var location = PressurePlot.Plot.GetCoordinates((float)pixel.X, (float)pixel.Y);

                _crosshair.Position = location;
                _crosshair.IsVisible = true;

                // 显示精确数值
                UpdateCrosshairLabel(location.X, location.Y);
                PressurePlot.Refresh();
            };

            PressurePlot.MouseLeave += (s, e) => {
                _crosshair.IsVisible = false;
                PressurePlot.Refresh();
            };
        }

        private void UpdateCrosshairLabel(double x, double y)
        {
            // 在图表标题中显示当前坐标信息
            PressurePlot.Plot.Title($"多容器压力监控 | X: {x:F2}s, Y: {y:F2}MPa", size: 16);
        }

        private void InitializeAlarmSystem()
        {
            _alarmManager = new AlarmManager();

            try
            {
                _alarmSound = new SoundPlayer("alarm.wav");
            }
            catch
            {
                // 如果没有音频文件,使用系统蜂鸣声
                _alarmSound = null;
            }

            // 配置报警规则
            foreach (var vessel in _vessels)
            {
                _alarmManager.AddRule(new AlarmRule
                {
                    VesselName = vessel.Name,
                    WarningThreshold = vessel.WarningMax,
                    AlarmThreshold = vessel.AlarmMax,
                    OnWarning = () => ShowWarningIndicator(vessel.Name),
                    OnAlarm = () => TriggerAlarm(vessel.Name)
                });
            }
        }

        private void StartMultiVesselMonitoring()
        {
            _cts = new CancellationTokenSource();

            // 启动数据采集线程(模拟100Hz采集)
            Task.Run(() => SimulateDataCollection(_cts.Token));

            // 启动UI更新定时器(25Hz刷新)
            _uiTimer = new DispatcherTimer
            {
                Interval = TimeSpan.FromMilliseconds(40)
            };
            _uiTimer.Tick += OnUIUpdate;
            _uiTimer.Start();
        }

        private async Task SimulateDataCollection(CancellationToken token)
        {
            while (!token.IsCancellationRequested)
            {
                try
                {
                    // 模拟每个容器的数据
                    _currentTime += 0.01; // 100Hz采样

                    foreach (var vessel in _vessels)
                    {
                        double pressure = GenerateVesselPressure(vessel);

                        var data = new VesselPressureData
                        {
                            VesselName = vessel.Name,
                            Timestamp = _currentTime,
                            Pressure = pressure
                        };

                        _dataQueue.Enqueue(data);
                    }

                    // 控制队列大小
                    while (_dataQueue.Count > 10000)
                    {
                        _dataQueue.TryDequeue(out _); // 丢弃旧数据
                    }

                    await Task.Delay(10, token); // 100Hz
                }
                catch (OperationCanceledException)
                {
                    break;
                }
            }
        }

        private double GenerateVesselPressure(VesselConfig vessel)
        {
            // 基础压力波动(模拟正常工艺过程)
            double baseWave = vessel.NormalMax * 0.75 + vessel.NormalMax * 0.3 * Math.Sin(_currentTime * 0.15);

            // 高频噪声
            double noise = (_random.NextDouble() - 0.5) * 0.12;

            // 偶发峰值(模拟工艺扰动)
            double spike = 0;
            if (_random.Next(10000) < 2) // 0.02%概率
            {
                spike = _random.NextDouble() * (vessel.AlarmMax - vessel.NormalMax);
            }

            return Math.Max(0, baseWave + noise + spike);
        }

        private void OnUIUpdate(object sender, EventArgs e)
        {
            // 批量处理队列中的数据
            var vesselDataDict = new Dictionary<string, List<VesselPressureData>>();

            int processedCount = 0;
            while (_dataQueue.TryDequeue(out var data) && processedCount < 1000)
            {
                if (!vesselDataDict.ContainsKey(data.VesselName))
                {
                    vesselDataDict[data.VesselName] = new List<VesselPressureData>();
                }
                vesselDataDict[data.VesselName].Add(data);
                processedCount++;
            }

            if (processedCount > 0)
            {
                UpdateVesselDisplayArrays(vesselDataDict);
                UpdateStatusIndicators();
                PressurePlot.Refresh();
            }
        }

        private void UpdateVesselDisplayArrays(Dictionary<string, List<VesselPressureData>> vesselDataDict)
        {
            foreach (var kvp in vesselDataDict)
            {
                if (_vesselData.ContainsKey(kvp.Key))
                {
                    var vesselMonitor = _vesselData[kvp.Key];

                    foreach (var data in kvp.Value)
                    {
                        // 写入环形缓冲区
                        vesselMonitor.DataBuffer[vesselMonitor.WriteIndex] = data.Pressure;
                        vesselMonitor.WriteIndex = (vesselMonitor.WriteIndex + 1) % BUFFER_SIZE;

                        // 检查报警
                        _alarmManager.CheckAlarms(kvp.Key, data.Pressure);
                    }

                    // 更新显示数组
                    UpdateSingleVesselDisplayArray(vesselMonitor);
                }
            }
        }

        private void UpdateSingleVesselDisplayArray(VesselMonitorData vesselData)
        {
            // 复制最新的DISPLAY_POINTS个点到显示数组
            int startIndex = (vesselData.WriteIndex - DISPLAY_POINTS + BUFFER_SIZE) % BUFFER_SIZE;

            if (startIndex + DISPLAY_POINTS <= BUFFER_SIZE)
            {
                // 连续复制
                Array.Copy(vesselData.DataBuffer, startIndex, vesselData.DisplayArray, 0, DISPLAY_POINTS);
            }
            else
            {
                // 分段复制(环形缓冲区跨界)
                int firstPart = BUFFER_SIZE - startIndex;
                Array.Copy(vesselData.DataBuffer, startIndex, vesselData.DisplayArray, 0, firstPart);
                Array.Copy(vesselData.DataBuffer, 0, vesselData.DisplayArray, firstPart, DISPLAY_POINTS - firstPart);
            }

            // 更新时间轴偏移
            vesselData.SignalPlot.Data.XOffset = _currentTime - DISPLAY_POINTS * 0.01;
        }

        private void UpdateStatusIndicators()
        {
            // 更新状态显示(这里以第一个容器为例)
            if (_vesselData.Count > 0)
            {
                var firstVessel = _vesselData.Values.First();
                double latestPressure = firstVessel.DataBuffer[(firstVessel.WriteIndex - 1 + BUFFER_SIZE) % BUFFER_SIZE];

                Application.Current.Dispatcher.BeginInvoke(() =>
                {
                    CurrentPressureText.Text = latestPressure.ToString("F3");

                    if (latestPressure >= firstVessel.Config.AlarmMax)
                    {
                        StatusText.Text = "危险报警";
                        StatusText.Foreground = System.Windows.Media.Brushes.Red;
                    }
                    else if (latestPressure >= firstVessel.Config.WarningMax)
                    {
                        StatusText.Text = "超限警告";
                        StatusText.Foreground = System.Windows.Media.Brushes.Orange;
                    }
                    else
                    {
                        StatusText.Text = "运行正常";
                        StatusText.Foreground = System.Windows.Media.Brushes.Lime;
                    }
                });
            }
        }

        private void ShowWarningIndicator(string vesselName)
        {
            // 显示警告指示
            System.Diagnostics.Debug.WriteLine($"警告: {vesselName} 压力超过警告阈值");
        }

        private void TriggerAlarm(string vesselName)
        {
            // 声光报警
            try
            {
                _alarmSound?.Play();
            }
            catch
            {
                // 如果声音文件播放失败,使用系统蜂鸣
                Console.Beep(1000, 500);
            }

            // 记录报警事件
            var alarmEvent = new AlarmEvent
            {
                VesselName = vesselName,
                Timestamp = DateTime.Now,
                AlarmType = AlarmType.Critical,
                Message = $"{vesselName}压力超限报警"
            };

            _alarmManager.LogAlarmEvent(alarmEvent);

            System.Diagnostics.Debug.WriteLine($"报警: {vesselName} - {alarmEvent.Message}");
        }

        protected override void OnClosed(EventArgs e)
        {
            _cts?.Cancel();
            _uiTimer?.Stop();
            base.OnClosed(e);
        }
    }
}

// 支持类定义
public class VesselConfig
{
    public string Name { get; set; }
    public ScottPlot.Color Color { get; set; }
    public double NormalMax { get; set; }
    public double WarningMax { get; set; }
    public double AlarmMax { get; set; }
}

public class VesselMonitorData
{
    public VesselConfig Config { get; set; }
    public double[] DataBuffer { get; set; }
    public double[] DisplayArray { get; set; }
    public ScottPlot.Plottables.Signal SignalPlot { get; set; }
    public ScottPlot.Plottables.HorizontalLine WarningLine { get; set; }
    public ScottPlot.Plottables.HorizontalLine AlarmLine { get; set; }
    public int WriteIndex { get; set; }
}
📊 性能优化核心总结
经过三个方案的实战,我总结了压力监控系统的关键优化要点:
🎯 三个核心收获
-
数据结构决定性能上限:环形缓冲区 + Signal数据绑定是处理高频数据的最佳组合,比传统Scatter性能提升5-10倍
-
批量处理是王道:将"来一个刷一次"改为"攒一批刷一次",配合固定刷新频率(25Hz),可将CPU占用降低70%以上
-
安全区域要"活"起来:保存阈值线对象引用,通过修改属性实现动态更新,避免删除重建造成的界面闪烁
💬 互动讨论区
话题一:你在项目中监控过哪些工业参数?除了压力,还有哪些参数需要安全区域标注?
话题二:对于超高频数据(1kHz以上),你觉得还有什么优化空间?欢迎分享你的经验!
实战挑战:尝试在方案二的基础上增加"暂停/恢复"功能,暂停时曲线静止但数据继续采集,恢复时快速补齐暂停期间的数据。实现后欢迎评论区分享代码!
如果这篇文章帮你解决了压力监控的技术难题,欢迎收藏转发给有需要的同事。工业软件开发路上,咱们互相帮助,共同进步!
技术标签:#C#开发 #WPF #ScottPlot #工业监控 #实时数据可视化 #性能优化
本文作者:技术老小子
本文链接:
版权声明:本博客所有文章除特别声明外,均采用 BY-NC-SA 许可协议。转载请注明出处!