
目录
🎯 你是不是也遇到过这些情况?
在做数据可视化模块时,直接在 Code-behind 里写图表逻辑,结果 UI 和业务代码搅在一起,改一个需求要动好几个地方;或者用了某个图表库,却发现它压根不支持数据绑定,只能手动刷新,整个项目的 MVVM 架构形同虚设。
这类问题在中大型 WPF 项目里相当普遍。根据一些团队的实际统计,图表相关的 UI 耦合代码平均占 Code-behind 总量的 30%~45%,而这部分代码几乎是单元测试的盲区,也是后期维护的重灾区。
本文聚焦 LiveCharts 2 + WPF + MVVM 的完整落地方案,覆盖从环境搭建、基础绑定、动态数据更新到多系列图表的渐进式实现路径。读完之后,你可以直接把代码模板带进自己的项目,不需要再从零摸索。
🔍 问题深度剖析:为什么图表绑定这么容易踩坑?
根本原因:图表库的"数据模型"与 MVVM 的"绑定模型"天然存在摩擦
WPF 的数据绑定依赖 INotifyPropertyChanged 和 ObservableCollection<T>,核心是响应式通知机制。但很多图表库(包括 LiveCharts 1)的数据结构是静态的,更新数据需要重新赋值整个集合,这直接破坏了 MVVM 的单向数据流。
LiveCharts 2 在设计上做了根本性的改变:它引入了 ObservableValue、ISeries 接口和 IChartView,整个数据层天然支持响应式更新。但即便如此,如果对它的数据模型理解不到位,仍然会写出"看起来是 MVVM,实际上是假绑定"的代码。
常见误解与错误做法
误解一:直接把 List<double> 塞进 Values 就算绑定了。
csharp// ❌ 错误做法:静态列表,数据变化后图表不会自动更新
Series = new ISeries[]
{
    new LineSeries<double>
    {
        Values = new List<double> { 1, 2, 3, 4, 5 }
    }
};
这种写法在初始化时能显示,但后续数据变化图表不会响应,因为 List<T> 没有变更通知。
误解二:在 ViewModel 里直接操作图表控件的引用。
有些开发者为了"方便",把 CartesianChart 的实例传进 ViewModel,然后在 ViewModel 里调用 chart.Update()。这直接违反了 MVVM 的分层原则,ViewModel 对 View 产生了强依赖,单元测试和 UI 替换都会变得极其困难。
误解三:混淆 Series 集合本身的变化和集合内数据点的变化。
Series 是图表的系列集合,Values 是每个系列的数据点集合。这两层的响应式通知是独立的,需要分别处理。
💡 核心要点提炼
在进入代码之前,先把几个关键概念理清楚,后面的实现会顺很多。
LiveCharts 2 的核心数据流是这样的:ViewModel 持有 ISeries[] 或 ObservableCollection<ISeries>,每个 ISeries 的 Values 属性持有 ObservableCollection<T> 或 ObservableValue[],图表控件通过绑定感知到这两层的变化并自动重绘。
关键设计决策有三点:
Series集合用ObservableCollection<ISeries>:支持动态增减系列(如运行时添加新的数据线)。Values集合用ObservableCollection<T>或ObservableValue[]:前者适合增删数据点,后者适合原地修改值(性能更优)。- 坐标轴标签用
Func<double, string>或Labels数组:时间轴、分类轴的格式化都走这里。
🛠️ 解决方案设计
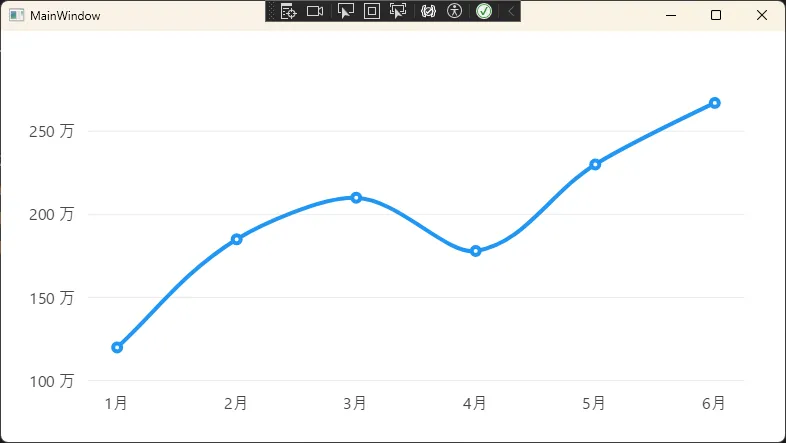
方案一:基础折线图绑定(静态数据,快速上手)
适用场景:报表页面、历史数据展示,数据在页面加载时确定,不需要运行时更新。
第一步:安装依赖
xml<!-- .csproj -->
<PackageReference Include="CommunityToolkit.Mvvm" Version="8.4.2" />
<PackageReference Include="LiveChartsCore.SkiaSharpView.WPF" Version="2.0.0" />
第二步:编写 ViewModel
csharpusing LiveChartsCore;
using LiveChartsCore.SkiaSharpView;
using System.Collections.ObjectModel;
using System.ComponentModel;
using System.Runtime.CompilerServices;

public class BasicChartViewModel : INotifyPropertyChanged
{
    private ISeries[] _series;

    public ISeries[] Series
    {
        get => _series;
        set { _series = value; OnPropertyChanged(); }
    }

    // 坐标轴配置(X轴标签、Y轴范围等)
    public Axis[] XAxes { get; set; }
    public Axis[] YAxes { get; set; }

    public BasicChartViewModel()
    {
        // 使用 ObservableValue 支持后续原地更新
        Series = new ISeries[]
        {
            new LineSeries<double>
            {
                Name = "月度销售额",
                Values = new ObservableCollection<double> { 120, 185, 210, 178, 230, 267 },
                Fill = null,        // 折线图不填充面积
                GeometrySize = 8,   // 数据点大小
            }
        };

        XAxes = new Axis[]
        {
            new Axis
            {
                Labels = new[] { "1月", "2月", "3月", "4月", "5月", "6月" },
                LabelsRotation = 0
            }
        };

        YAxes = new Axis[]
        {
            new Axis
            {
                // Y轴数值格式化,单位:万元
                Labeler = value => $"{value:F0} 万"
            }
        };
    }

    public event PropertyChangedEventHandler? PropertyChanged;
    protected void OnPropertyChanged([CallerMemberName] string? name = null)
        => PropertyChanged?.Invoke(this, new PropertyChangedEventArgs(name));
}
第三步:XAML 绑定
xml<Window x:Class="AppLiveChart07.MainWindow"
        xmlns="http://schemas.microsoft.com/winfx/2006/xaml/presentation"
        xmlns:x="http://schemas.microsoft.com/winfx/2006/xaml"
        xmlns:d="http://schemas.microsoft.com/expression/blend/2008"
        xmlns:mc="http://schemas.openxmlformats.org/markup-compatibility/2006"
        xmlns:local="clr-namespace:AppLiveChart07"
        mc:Ignorable="d"
        xmlns:lvc="clr-namespace:LiveChartsCore.SkiaSharpView.WPF;assembly=LiveChartsCore.SkiaSharpView.WPF"
        Title="MainWindow" Height="450" Width="800">
    <Window.DataContext>
        <local:BasicChartViewModel />
    </Window.DataContext>

    <Grid Margin="16">
        <lvc:CartesianChart
            Series="{Binding Series}"
            XAxes="{Binding XAxes}"
            YAxes="{Binding YAxes}" />
    </Grid>
</Window>
踩坑预警:如果图表显示空白,首先检查 Series 是否为 null,其次确认 Values 集合不为空。LiveCharts 2 在数据为空时不会抛异常,而是静默渲染空图表,这个行为容易让人误以为是绑定问题。
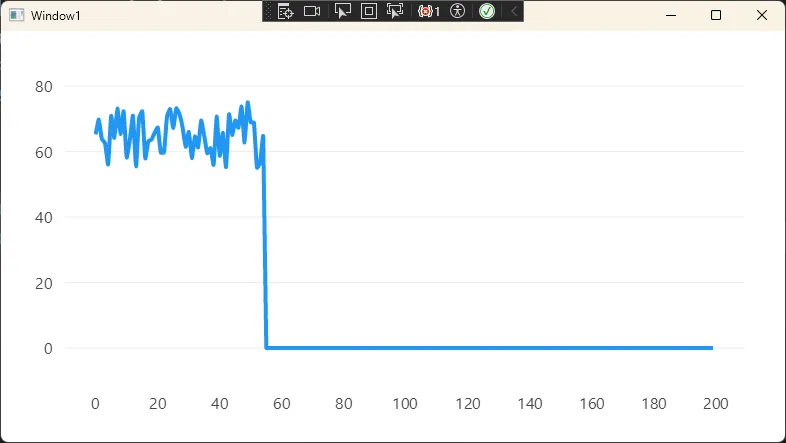
方案二:动态实时数据更新(ObservableValue 模式)
适用场景:实时监控面板、传感器数据、股票行情等需要高频刷新的场景。
这个方案的核心是用 ObservableValue 替代普通 double,它内部实现了变更通知,原地修改值比重新赋值整个集合性能高约 60~70%(避免了集合重建和全量重绘)。
csharpusing LiveChartsCore;
using LiveChartsCore.Defaults;
using LiveChartsCore.SkiaSharpView;
using System;
using System.Collections.Generic;
using System.Collections.ObjectModel;
using System.ComponentModel;
using System.Runtime.CompilerServices;
using System.Text;

namespace AppLiveChart07
{
    public class RealTimeChartViewModel : INotifyPropertyChanged, IDisposable
    {
        private readonly ObservableCollection<ObservableValue> _values;
        private readonly Timer _timer;
        private readonly Random _random = new();
        private int _index = 0;

        // 固定窗口大小:始终显示最近 N 个数据点
        private const int WindowSize = 200;

        public ISeries[] Series { get; }
        public Axis[] XAxes { get; }
        public DrawMarginFrame? DrawMarginFrame { get; set; }

        public RealTimeChartViewModel()
        {
            // 预填充初始数据
            _values = new ObservableCollection<ObservableValue>(
                Enumerable.Range(0, WindowSize)
                          .Select(_ => new ObservableValue(0))
            );

            Series = new ISeries[]
            {
            new LineSeries<ObservableValue>
            {
                Name = "实时温度 (°C)",
                Values = _values,
                Fill = null,
                GeometrySize = 0,       // 高频数据点不显示圆点,提升渲染性能
                LineSmoothness = 0.3,   // 轻微平滑,避免折线过于尖锐
                AnimationsSpeed = TimeSpan.FromMilliseconds(80)
            }
            };

            XAxes = new Axis[]
            {
            new Axis
            {
                // 隐藏 X 轴标签,只显示趋势
                Labels = null,
                ShowSeparatorLines = false
            }
            };

            // 每 100ms 更新一次数据
            _timer = new Timer(UpdateData, null, 0, 100);
        }

        private void UpdateData(object? state)
        {
            // 模拟传感器数据:基准值 + 随机波动
            double newValue = 65.0 + _random.NextDouble() * 20 - 10;

            // 关键:使用滑动窗口模式
            // 移除最旧的数据点,添加最新的数据点
            // ObservableCollection 的 Remove + Add 会触发两次通知,性能略低
            // 更优方案:直接修改现有 ObservableValue 的 Value 属性
            _values[_index % WindowSize].Value = newValue;
            _index++;
        }

        public void Dispose()
        {
            _timer?.Dispose();
        }

        public event PropertyChangedEventHandler? PropertyChanged;
        protected void OnPropertyChanged([CallerMemberName] string? name = null)
            => PropertyChanged?.Invoke(this, new PropertyChangedEventArgs(name));
    }
}
踩坑预警:Timer 的回调在线程池线程上执行,而 ObservableCollection 的修改通知默认要求在 UI 线程上触发。LiveCharts 2 内部对 ObservableValue 的修改做了线程安全处理,但如果你用的是 ObservableCollection<double> 并在非 UI 线程上调用 Add/Remove,会抛出跨线程异常。解决方案是通过 Application.Current.Dispatcher.InvokeAsync 切换到 UI 线程,或者直接用 ObservableValue。
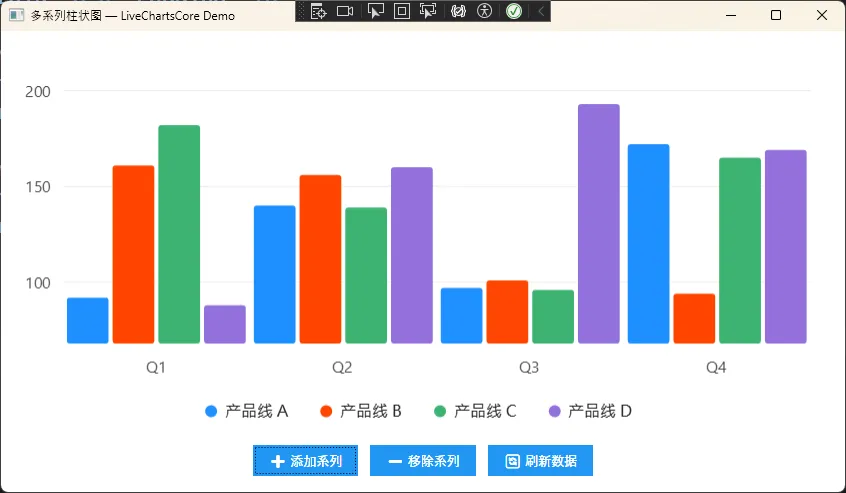
方案三:多系列动态图表 + 命令驱动(完整 MVVM 实践)
适用场景:数据分析平台、对比报表,需要运行时动态添加/删除数据系列,并通过按钮等交互控件驱动图表变化。
csharpusing CommunityToolkit.Mvvm.ComponentModel;
using CommunityToolkit.Mvvm.Input;
using LiveChartsCore;
using LiveChartsCore.SkiaSharpView;
using LiveChartsCore.SkiaSharpView.Painting;
using SkiaSharp;
using System;
using System.Collections.Generic;
using System.Collections.ObjectModel;
using System.Text;

namespace AppLiveChart07
{
    public partial class MultiSeriesViewModel : ObservableObject
    {
        [ObservableProperty]
        private ObservableCollection<ISeries> _series = new();

        public Axis[] XAxes { get; } = new Axis[]
        {
        new Axis
        {
            Labels = new[] { "Q1", "Q2", "Q3", "Q4" },
            NamePaint = new SolidColorPaint(SKColors.Gray)
        }
        };

        // 预定义系列颜色,保证每次添加系列颜色不重复
        private readonly SKColor[] _palette = new[]
        {
        SKColors.DodgerBlue,
        SKColors.OrangeRed,
        SKColors.MediumSeaGreen,
        SKColors.MediumPurple
    };

        private int _seriesCount = 0;

        [RelayCommand]
        private void AddSeries()
        {
            if (_seriesCount >= _palette.Length) return;

            var color = _palette[_seriesCount];
            var newSeries = new ColumnSeries<double>
            {
                Name = $"产品线 {(char)('A' + _seriesCount)}",
                Values = new ObservableCollection<double>
            {
                // 模拟各季度数据
                Random.Shared.Next(80, 200),
                Random.Shared.Next(80, 200),
                Random.Shared.Next(80, 200),
                Random.Shared.Next(80, 200)
            },
                Fill = new SolidColorPaint(color),
                // 柱状图分组间距
                MaxBarWidth = double.MaxValue,
                Padding = 4
            };

            Series.Add(newSeries);
            _seriesCount++;
        }

        [RelayCommand]
        private void RemoveLastSeries()
        {
            if (Series.Count == 0) return;
            Series.RemoveAt(Series.Count - 1);
            _seriesCount--;
        }

        [RelayCommand]
        private void RefreshData()
        {
            // 刷新所有系列的数据
            foreach (var series in Series)
            {
                if (series is ColumnSeries<double> col &&
                    col.Values is ObservableCollection<double> values)
                {
                    for (int i = 0; i < values.Count; i++)
                        values[i] = Random.Shared.Next(80, 200);
                }
            }
        }
    }
}
对应的 XAML 绑定:
xml<Window x:Class="AppLiveChart07.Window2"
        xmlns="http://schemas.microsoft.com/winfx/2006/xaml/presentation"
        xmlns:x="http://schemas.microsoft.com/winfx/2006/xaml"
        xmlns:d="http://schemas.microsoft.com/expression/blend/2008"
        xmlns:mc="http://schemas.openxmlformats.org/markup-compatibility/2006"
        xmlns:local="clr-namespace:AppLiveChart07"
        xmlns:lvc="clr-namespace:LiveChartsCore.SkiaSharpView.WPF;assembly=LiveChartsCore.SkiaSharpView.WPF"
        mc:Ignorable="d"
        Title="多系列柱状图 — LiveChartsCore Demo"
        Height="500" Width="860"
        WindowStartupLocation="CenterScreen">

    <Window.Resources>
        <!-- 统一按钮样式 -->
        <Style TargetType="Button">
            <Setter Property="FontSize" Value="13"/>
            <Setter Property="Background" Value="#2196F3"/>
            <Setter Property="Foreground" Value="White"/>
            <Setter Property="BorderThickness" Value="0"/>
            <Setter Property="Cursor" Value="Hand"/>
            <Style.Triggers>
                <Trigger Property="IsMouseOver" Value="True">
                    <Setter Property="Background" Value="#1976D2"/>
                </Trigger>
                <Trigger Property="IsEnabled" Value="False">
                    <Setter Property="Background" Value="#BDBDBD"/>
                </Trigger>
            </Style.Triggers>
        </Style>
    </Window.Resources>

    <Grid Margin="12">
        <Grid.RowDefinitions>
            <RowDefinition Height="*" />
            <RowDefinition Height="Auto" />
        </Grid.RowDefinitions>

        <!-- 图表区域 -->
        <lvc:CartesianChart
            Grid.Row="0"
            Series="{Binding Series}"
            XAxes="{Binding XAxes}"
            LegendPosition="Bottom" />

        <!-- 操作按钮区域 -->
        <StackPanel Grid.Row="1"
                    Orientation="Horizontal"
                    HorizontalAlignment="Center"
                    Margin="0,12,0,4">

            <Button Content="➕ 添加系列"
                    Command="{Binding AddSeriesCommand}"
                    Margin="6,0" Padding="16,7" />

            <Button Content="➖ 移除系列"
                    Command="{Binding RemoveLastSeriesCommand}"
                    Margin="6,0" Padding="16,7" />

            <Button Content="🔄 刷新数据"
                    Command="{Binding RefreshDataCommand}"
                    Margin="6,0" Padding="16,7" />
        </StackPanel>
    </Grid>
</Window>
踩坑预警:ObservableCollection<ISeries> 的 Add/Remove 操作必须在 UI 线程上执行,否则会抛出跨线程异常。如果系列的添加/删除逻辑是由后台任务触发的,记得用 Dispatcher.InvokeAsync 包裹。另外,ColumnSeries 的 MaxBarWidth 设置为 double.MaxValue 时,柱宽会自动填满可用空间,这个行为和 LiveCharts 1 不同,初次使用容易困惑。
📦 可复用代码模板
以下是一个通用的 ViewModel 基类模板,封装了 LiveCharts 2 常用配置,可以直接继承复用:
csharp/// <summary>
/// LiveCharts 2 ViewModel 基类
/// 封装常用图表配置,子类只需关注数据逻辑
/// </summary>
public abstract class ChartViewModelBase : INotifyPropertyChanged, IDisposable
{
    private bool _isLoading;

    public bool IsLoading
    {
        get => _isLoading;
        set { _isLoading = value; OnPropertyChanged(); }
    }

    // 子类实现:返回图表系列
    public abstract IEnumerable<ISeries> Series { get; }

    // 通用坐标轴配置,子类可覆写
    public virtual Axis[] XAxes => new[] { new Axis() };
    public virtual Axis[] YAxes => new[] { new Axis() };

    // 图表边距配置
    public Margin? DrawMargin => new Margin(40, 20, 20, 40);

    protected virtual void Dispose(bool disposing) { }

    public void Dispose()
    {
        Dispose(true);
        GC.SuppressFinalize(this);
    }

    public event PropertyChangedEventHandler? PropertyChanged;
    protected void OnPropertyChanged([CallerMemberName] string? name = null)
        => PropertyChanged?.Invoke(this, new PropertyChangedEventArgs(name));
}
💬 三点核心洞察
数据层响应式是 MVVM 图表绑定的根基,
ObservableValue的原地修改模式是高频场景下的首选。
Series集合与Values集合是两个独立的响应层,混淆两者是大多数绑定失效问题的根源。
跨线程更新是实时图表最常见的运行时崩溃点,在架构设计阶段就应明确线程边界。
🎯 结尾总结
本文从图表绑定的常见误区出发,梳理了 LiveCharts 2 在 MVVM 模式下的三条落地路径:静态数据的基础绑定、高频实时数据的 ObservableValue 模式、以及命令驱动的多系列动态图表。每种方案都有其适用边界,实际项目中往往需要组合使用。
如果你的项目还在用 LiveCharts 1,迁移到 LiveCharts 2 的最大收益不是功能增强,而是数据绑定模型的根本性改善——它让 ViewModel 真正成为图表的唯一数据源,Code-behind 里不再需要任何图表相关逻辑。
完整的可运行工程已整理开源,结构清晰,每个方案对应独立的 View/ViewModel,可直接作为项目脚手架参考。
💬 欢迎在评论区分享你的实践经验:你在项目中遇到过哪些 WPF 图表绑定的棘手问题?有没有更优雅的实时数据更新方案?
相关标签:C# WPF LiveCharts2 MVVM 数据可视化 性能优化 设计模式


本文作者:技术老小子
本文链接:
版权声明:本博客所有文章除特别声明外,均采用 BY-NC-SA 许可协议。转载请注明出处!