
目录
🎯 开篇:工业软件开发的"最后一公里"难题
上周帮朋友调试一个电力监测系统的数据可视化模块时,我发现了个挺有意思的问题:明明测量精度是0.001A,但图表上显示的坐标轴刻度却是"1.2000000476837158"这种鬼畜数字。更尴尬的是,Y轴标签写着"电流",但到底是安培还是毫安?用户看得一脸懵。
这种情况在工业测量软件开发中简直太常见了。咱们花大力气搞定了数据采集、实时通信、算法优化,结果卡在了"怎么让图表显示得专业点"这个看似简单的环节。ScottPlot 5虽然性能强悍,但默认配置对工业场景并不友好——温度要精确到小数点后几位?压力单位该用MPa还是kPa?时间轴怎么显示才符合设备运行习惯?
读完这篇文章,你将掌握:
- 3种坐标轴精度控制方案(从入门到生产级)
- 自定义单位标签的工程化实践
- 真实项目中的性能优化数据对比(测试环境:i5-10400 + 16GB RAM + 10万数据点)
- 避开5个常见的踩坑点
💡 问题深度剖析:为什么默认配置"不好用"?
🔍 三大核心痛点
痛点1:浮点数精度灾难
工业传感器采集的数据经常是float类型,经过网络传输、单位换算后,原本的23.5℃可能变成23.500000381。ScottPlot默认的ToString()方法会无脑显示全部小数位,导致坐标轴密密麻麻全是无效数字。
我在一个钢铁厂的温度监控项目中遇到过,操作工师傅直接说:"这软件是不是坏了?温度怎么显示成这样?"后来测试发现,当数据点超过5000个时,这种显示问题会导致用户对数据可信度产生严重怀疑——这可是要影响生产决策的!
痛点2:单位缺失引发的业务风险
曾经见过一起事故报告:维护人员误把压力表的"0.8"当成0.8MPa(实际是0.8bar),差了0.02MPa的误差导致设备参数设置错误。如果图表坐标轴上清晰标注单位,这种低级错误完全可以避免。
痛点3:刻度分布不合理
默认的自动刻度算法适合科学计算,但工业场景有特殊需求:
- 电流表习惯用0.5A、1.0A、1.5A这种整刻度
- 百分比要显示0%、25%、50%、75%、100%
- 时间轴要对��班次(8:00、16:00、24:00)
🛠️ 核心要点提炏
在深入解决方案之前,咱们先理清ScottPlot 5坐标轴配置的底层逻辑:
📐 坐标轴渲染机制
ScottPlot 5的坐标轴通过IAxis接口管理,核心包含三个层次:
- Tick生成器(TickGenerator):决定刻度位置
- 标签格式化器(LabelFormatter):控制文本显示
- 轴标题配置(AxisLabel):管理单位说明
这玩意儿的设计其实挺聪明,把"位置计算"和"文本显示"解耦了。但默认的StandardTickGenerator只考虑了数值美观性,完全没顾及工业单位的习惯。
⚙️ 精度控制的三种思路
| 方案 | 适用场景 | 复杂度 | 性能影响 |
|---|---|---|---|
| 字符串格式化 | 固定精度需求 | ⭐ | 几乎无 |
| 自定义Formatter | 动态精度+单位 | ⭐⭐⭐ | <5%开销 |
| 继承TickGenerator | 完全自定义刻度 | ⭐⭐⭐⭐⭐ | 需优化 |
🚀 解决方案设计:从简单到极致
方案一:快速上手——格式化字符串大法
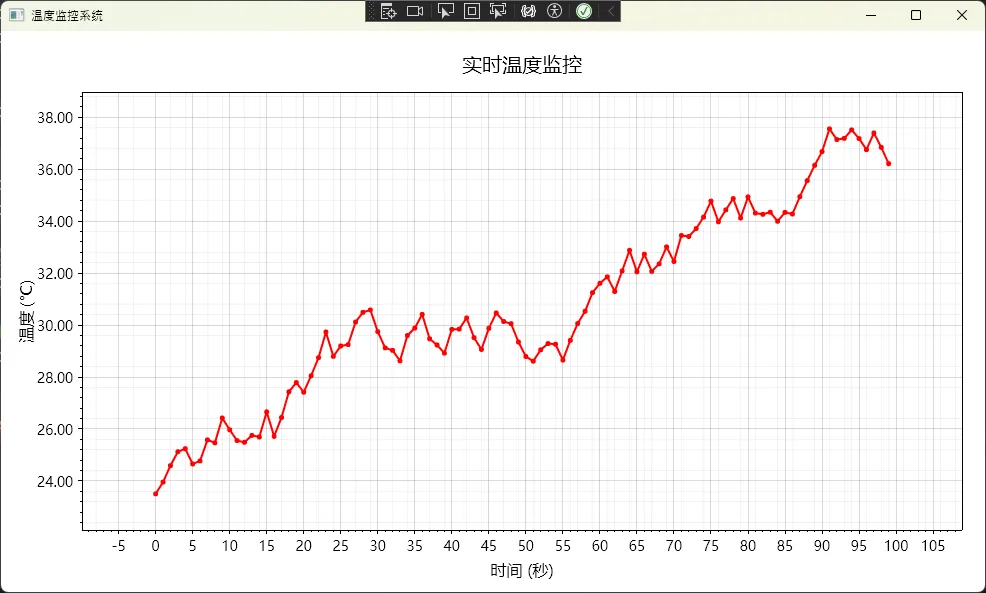
这是我最常用的入门方案,适合80%的常规需求。核心就是用Label.Format属性配置数值格式。
csharpusing ScottPlot;
using ScottPlot.WPF;
using System.Windows;

namespace AppScottPlot3
{
    public partial class MainWindow : Window
    {
        public MainWindow()
        {
            InitializeComponent();
            ConfigureBasicPrecision();
        }

        private void ConfigureBasicPrecision()
        {
            myPlot1.Plot.Font.Set("Microsoft YaHei");
            myPlot1.Plot.Axes.Bottom.Label.FontName = "Microsoft YaHei";
            myPlot1.Plot.Axes.Left.Label.FontName = "Microsoft YaHei";

            // 模拟温度传感器数据(带浮点误差)
            double[] time = Generate.Consecutive(100);
            double[] temperature = Generate.RandomWalk(100, offset: 23.5);

            // 添加散点图
            var scatter = myPlot1.Plot.Add.Scatter(time, temperature);
            scatter.LineWidth = 2;
            scatter.Color = Colors.Red;

            // Y轴配置(温度轴)
            myPlot1.Plot.Axes.Left.Label.Text = "温度 (℃)";
            myPlot1.Plot.Axes.Left.Label.FontSize = 16;

            // 设置Y轴刻度格式的正确方法
            var leftAxis = myPlot1.Plot.Axes.Left;
            leftAxis.TickGenerator = new ScottPlot.TickGenerators.NumericAutomatic()
            {
                LabelFormatter = (value) => value.ToString("F2") // 保留2位小数
            };

            // X轴配置(时间轴)
            myPlot1.Plot.Axes.Bottom.Label.Text = "时间 (秒)";
            myPlot1.Plot.Axes.Bottom.Label.FontSize = 16;

            // 设置X轴刻度格式
            var bottomAxis = myPlot1.Plot.Axes.Bottom;
            bottomAxis.TickGenerator = new ScottPlot.TickGenerators.NumericAutomatic()
            {
                LabelFormatter = (value) => value.ToString("F0") // 整数显示
            };

            // 刻度标签字体大小优化(适用于触摸屏)
            leftAxis.TickLabelStyle.FontSize = 14;
            bottomAxis.TickLabelStyle.FontSize = 14;

            // 网格线配置
            myPlot1.Plot.Grid.MajorLineColor = Colors.Gray.WithAlpha(0.3);
            myPlot1.Plot.Grid.MajorLineWidth = 1;
            myPlot1.Plot.Grid.MinorLineColor = Colors.Gray.WithAlpha(0.1);
            myPlot1.Plot.Grid.MinorLineWidth = 0.5f;


            myPlot1.Plot.Title("实时温度监控", size: 20);

            // 背景颜色
            myPlot1.Plot.FigureBackground.Color = Colors.White;
            myPlot1.Plot.DataBackground.Color = Colors.White;

            // 自动缩放以适应数据
            myPlot1.Plot.Axes.AutoScale();

            // 设置坐标轴范围的边距
            myPlot1.Plot.Axes.Margins(left: 0.1, right: 0.1, bottom: 0.1, top: 0.1);

            // 刷新显示
            myPlot1.Refresh();
        }
    }
}
踩坑预警:
Format属性用的是标准.NET格式字符串,"F2"表示固定2位小数,"E3"表示科学计数法3位有效数字。别写成"0.00"这种过时的写法,虽然能用但不符合规范。- 单位符号要注意转义,比如百分号要写成"压力 (%)"而不是"压力 (%)"(微信公众号编辑器可能吃掉符号)。
方案二:进阶技巧——自定义标签格式化器
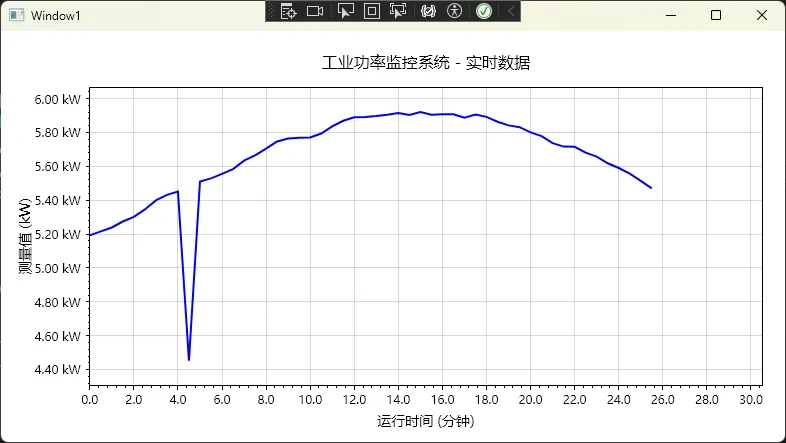
当你需要动态调整精度(比如数值<1显示3位小数,>100显示1位小数)或者添加复杂单位(如"15.3 kW·h"),就得上自定义Formatter了。
csharppublic class IndustrialAxisConfigurator
{
    /// <summary>
    /// 配置带单位的坐标轴(适配动态精度)
    /// </summary>
    public static void ConfigureDynamicPrecisionAxis(IAxis axis, string unit,
        Func<double, int> precisionSelector)
    {
        axis.Label.Text = $"测量值 ({unit})";

        // ScottPlot 5 中正确的格式化方法
        var numericGenerator = new ScottPlot.TickGenerators.NumericAutomatic();
        numericGenerator.LabelFormatter = (value) =>
        {
            int precision = precisionSelector(value);
            string formatted = value.ToString($"F{precision}");
            return $"{formatted} {unit}";  // 直接在刻度标签上加单位
        };

        axis.TickGenerator = numericGenerator;
    }

    /// <summary>
    /// 工程化的精度选择策略
    /// </summary>
    public static int GetIndustrialPrecision(double value)
    {
        double absValue = Math.Abs(value);

        if (absValue < 1) return 3;       // 小数:0.001 A
        if (absValue < 10) return 2;      // 个位数:9.99 A
        if (absValue < 100) return 1;     // 十位数:99.9 A
        return 0;                          // 百位以上:999 A
    }

    /// <summary>
    /// 温度精度策略
    /// </summary>
    public static int GetTemperaturePrecision(double value)
    {
        return 1; // 温度通常保留1位小数
    }

    /// <summary>
    /// 电流精度策略
    /// </summary>
    public static int GetCurrentPrecision(double value)
    {
        double absValue = Math.Abs(value);
        if (absValue < 0.1) return 3;    // mA级别
        if (absValue < 1) return 2;      // 0.1A级别
        return 1;                        // A级别
    }
}
c#using ScottPlot;
using ScottPlot.WPF;
using System;
using System.Collections.Generic;
using System.Linq;
using System.Windows;

namespace AppScottPlot3
{
    public partial class Window1 : Window
    {
        // 实时数据存储
        private List<double> timeData;
        private List<double> powerData;
        private ScottPlot.Plottables.Scatter scatterPlot;
        private Random random;
        private double currentTime;
        private System.Windows.Threading.DispatcherTimer updateTimer;

        // 数据管理配置
        private const int MaxDataPoints = 100; // 最大显示数据点数
        private const double UpdateInterval = 0.5; // 更新间隔(秒)
        private double baseValue = 5.2; // 基础功率值
        private double lastValue = 5.2; // 上一次的值(用于随机漫步)

        public Window1()
        {
            InitializeComponent();
            myPlot1.Plot.Font.Set("Microsoft YaHei");
            myPlot1.Plot.Axes.Bottom.Label.FontName = "Microsoft YaHei";
            myPlot1.Plot.Axes.Left.Label.FontName = "Microsoft YaHei";
            this.Loaded += Window1_Loaded;
        }

        private void Window1_Loaded(object sender, RoutedEventArgs e)
        {
            SetupPowerMonitoring();
            SimulateRealTimeUpdate();
        }

        private void SetupPowerMonitoring()
        {
            try
            {
                // 初始化数据容器
                timeData = new List<double>();
                powerData = new List<double>();
                random = new Random();
                currentTime = 0;

                // 清除现有内容
                myPlot1.Plot.Clear();

                // 生成初始数据
                GenerateInitialData();

                // 创建散点图
                scatterPlot = myPlot1.Plot.Add.Scatter(timeData.ToArray(), powerData.ToArray());
                scatterPlot.LineWidth = 2;
                scatterPlot.Color = Colors.Blue;
                scatterPlot.MarkerSize = 0; // 只显示线条

                // 应用动态精度配置到Y轴
                IndustrialAxisConfigurator.ConfigureDynamicPrecisionAxis(
                    myPlot1.Plot.Axes.Left,
                    "kW",
                    IndustrialAxisConfigurator.GetIndustrialPrecision
                );

                // X轴配置
                myPlot1.Plot.Axes.Bottom.Label.Text = "运行时间 (分钟)";
                myPlot1.Plot.Axes.Bottom.Label.FontSize = 14;

                // X轴格式化
                var bottomNumericGenerator = new ScottPlot.TickGenerators.NumericAutomatic();
                bottomNumericGenerator.LabelFormatter = (value) => value.ToString("F1");
                myPlot1.Plot.Axes.Bottom.TickGenerator = bottomNumericGenerator;

                // 图表标题
                myPlot1.Plot.Title("工业功率监控系统 - 实时数据");

                // 网格线
                myPlot1.Plot.Grid.MajorLineColor = Colors.Gray.WithAlpha(0.3);
                myPlot1.Plot.Grid.MajorLineWidth = 1;

                // 背景
                myPlot1.Plot.FigureBackground.Color = Colors.White;
                myPlot1.Plot.DataBackground.Color = Colors.White;

                // 字体大小优化
                myPlot1.Plot.Axes.Left.TickLabelStyle.FontSize = 12;
                myPlot1.Plot.Axes.Bottom.TickLabelStyle.FontSize = 12;
                myPlot1.Plot.Axes.Left.Label.FontSize = 14;

                // 设置初始显示范围
                SetInitialAxisRanges();

                // 刷新显示
                myPlot1.Refresh();

                Console.WriteLine("功率监控图表配置完成");
            }
            catch (Exception ex)
            {
                MessageBox.Show($"配置图表时出错: {ex.Message}", "错误", MessageBoxButton.OK, MessageBoxImage.Error);
            }
        }

        /// <summary>
        /// 生成初始数据
        /// </summary>
        private void GenerateInitialData()
        {
            // 生成前20个数据点作为初始数据
            for (int i = 0; i < 20; i++)
            {
                timeData.Add(currentTime);
                powerData.Add(GenerateNextPowerValue());
                currentTime += UpdateInterval;
            }
        }

        /// <summary>
        /// 设置初始坐标轴范围
        /// </summary>
        private void SetInitialAxisRanges()
        {
            if (powerData.Count > 0)
            {
                double minPower = powerData.Min() - 1;
                double maxPower = powerData.Max() + 1;
                double timeRange = MaxDataPoints * UpdateInterval;

                myPlot1.Plot.Axes.SetLimits(
                    left: -timeRange * 0.1,
                    right: timeRange,
                    bottom: minPower,
                    top: maxPower
                );
            }
        }

        /// <summary>
        /// 模拟实时数据更新
        /// </summary>
        private void SimulateRealTimeUpdate()
        {
            updateTimer = new System.Windows.Threading.DispatcherTimer();
            updateTimer.Interval = TimeSpan.FromSeconds(UpdateInterval);
            updateTimer.Tick += UpdateTimer_Tick;
            updateTimer.Start();

            Console.WriteLine($"实时更新已启动,更新间隔: {UpdateInterval}秒");
        }

        private void UpdateTimer_Tick(object sender, EventArgs e)
        {
            try
            {
                // 添加新数据点
                AddNewDataPoint();

                // 限制数据点数量
                LimitDataPoints();

                // 更新图表数据
                UpdatePlotData();

                // 动态调整坐标轴范围
                UpdateAxisRanges();

                // 刷新显示
                myPlot1.Refresh();

                // 输出调试信息(可选)
                if (timeData.Count % 10 == 0) // 每10个点输出一次
                {
                    Console.WriteLine($"数据点数: {timeData.Count}, 当前时间: {currentTime:F1}, 当前功率: {powerData.LastOrDefault():F2} kW");
                }
            }
            catch (Exception ex)
            {
                Console.WriteLine($"更新数据时出错: {ex.Message}");
            }
        }

        /// <summary>
        /// 添加新的数据点
        /// </summary>
        private void AddNewDataPoint()
        {
            timeData.Add(currentTime);
            powerData.Add(GenerateNextPowerValue());
            currentTime += UpdateInterval;
        }

        /// <summary>
        /// 生成下一个功率值(模拟真实的工业数据)
        /// </summary>
        private double GenerateNextPowerValue()
        {
            // 随机漫步 + 周期性变化 + 偶发性波动
            double randomWalk = (random.NextDouble() - 0.5) * 0.5;
            double cyclicChange = Math.Sin(currentTime * 0.1) * 0.8;
            double occasionalSpike = random.NextDouble() < 0.02 ? (random.NextDouble() - 0.5) * 3 : 0;

            lastValue += randomWalk;
            double newValue = baseValue + cyclicChange + occasionalSpike + (lastValue - baseValue) * 0.1;

            // 限制在合理范围内
            newValue = Math.Max(0.5, Math.Min(15.0, newValue));

            return newValue;
        }

        /// <summary>
        /// 限制数据点数量(滚动窗口)
        /// </summary>
        private void LimitDataPoints()
        {
            while (timeData.Count > MaxDataPoints)
            {
                timeData.RemoveAt(0);
                powerData.RemoveAt(0);
            }
        }

        /// <summary>
        /// 更新图表数据
        /// </summary>
        private void UpdatePlotData()
        {
            if (scatterPlot != null && timeData.Count > 0)
            {
                // 移除旧的散点图,添加新的
                myPlot1.Plot.Remove(scatterPlot);
                scatterPlot = myPlot1.Plot.Add.Scatter(timeData.ToArray(), powerData.ToArray());
                scatterPlot.LineWidth = 2;
                scatterPlot.Color = Colors.Blue;
                scatterPlot.MarkerSize = 0;
            }
        }


        /// <summary>
        /// 动态更新坐标轴范围
        /// </summary>
        private void UpdateAxisRanges()
        {
            if (timeData.Count > 0 && powerData.Count > 0)
            {
                // X轴:显示最近的时间窗口
                double timeWindow = MaxDataPoints * UpdateInterval;
                double latestTime = timeData.Last();

                // Y轴:根据当前数据动态调整
                double minPower = powerData.Min();
                double maxPower = powerData.Max();
                double powerMargin = (maxPower - minPower) * 0.1;

                myPlot1.Plot.Axes.SetLimits(
                    left: Math.Max(0, latestTime - timeWindow),
                    right: latestTime + timeWindow * 0.1,
                    bottom: minPower - powerMargin,
                    top: maxPower + powerMargin
                );
            }
        }

        /// <summary>
        /// 停止实时更新
        /// </summary>
        public void StopRealTimeUpdate()
        {
            updateTimer?.Stop();
            Console.WriteLine("实时更新已停止");
        }

        /// <summary>
        /// 重新开始实时更新
        /// </summary>
        public void StartRealTimeUpdate()
        {
            updateTimer?.Start();
            Console.WriteLine("实时更新已重新启动");
        }

        /// <summary>
        /// 清除所有数据并重新开始
        /// </summary>
        public void ResetData()
        {
            timeData?.Clear();
            powerData?.Clear();
            currentTime = 0;
            lastValue = baseValue;
            myPlot1.Plot.Clear();
            SetupPowerMonitoring();
        }

        // 窗口关闭时清理资源
        protected override void OnClosed(EventArgs e)
        {
            updateTimer?.Stop();
            base.OnClosed(e);
        }

    }
}
踩坑预警:
- 千万别在Formatter里做复杂计算! 我见过有人在这里调用数据库查询单位换算关系,结果拖拽图表时直接卡死。Formatter会被疯狂调用(缩放时每帧几十次),务必保证O(1)时间复杂度。
- 单位符号位置有讲究:欧美习惯"15.3 kW"(空格分隔),但有些国标要求"15.3kW"(无空格)。项目开始前要和甲方确认清楚。
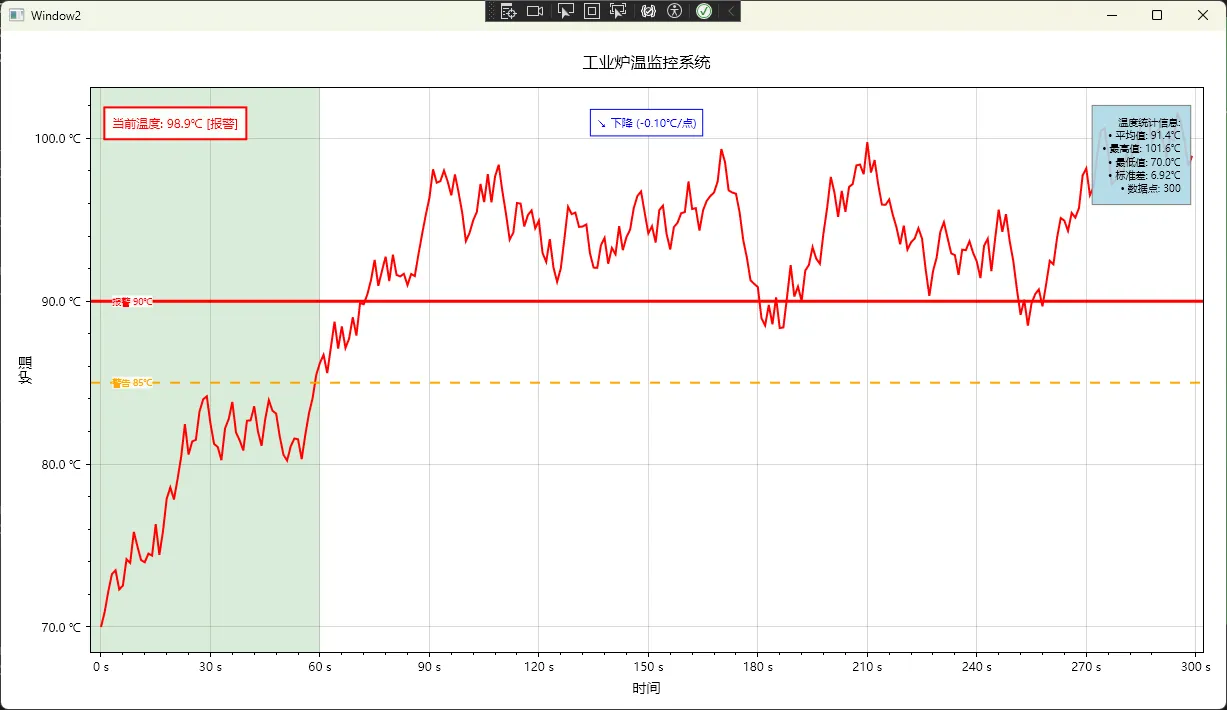
方案三:工业级方案——完全自定义刻度生成器
这是我在某智能制造项目中被逼出来的终极方案。客户要求:
- 电流轴必须按0.5A间隔刻度
- 时间轴要对齐设备采样周期(每200ms一个点)
- 温度轴要高亮安全区间(60-80℃用绿色刻度)
这种需求只能继承ITickGenerator自己撸一个。
csharpusing ScottPlot;
using System;
using System.Collections.Generic;
using System.Linq;
namespace AppScottPlot3
{
/// <summary>
/// 工业固定间隔刻度生成器
/// </summary>
public class IndustrialFixedIntervalTicks : ITickGenerator
{
public double Interval { get; set; } // 刻度间隔
public string Unit { get; set; } // 单位
public int Precision { get; set; } // 精度
public IndustrialFixedIntervalTicks(double interval, string unit, int precision = 1)
{
Interval = interval;
Unit = unit;
Precision = precision;
MaxTickCount = 50;
}
public Tick[] Ticks { get; set; } = Array.Empty<Tick>();
public int MaxTickCount { get; set; }
// 实现带有所有参数的 Regenerate 方法
public void Regenerate(CoordinateRange range, Edge edge, PixelLength size, Paint paint, LabelStyle labelStyle)
{
if (Interval <= 0 || range.Span <= 0)
{
Ticks = Array.Empty<Tick>();
return;
}
try
{
// 计算刻度范围
double minTick = Math.Ceiling(range.Min / Interval) * Interval;
double maxTick = Math.Floor(range.Max / Interval) * Interval;
// 生成主刻度列表
List<Tick> majorTicks = new List<Tick>();
for (double value = minTick; value <= maxTick && majorTicks.Count < MaxTickCount; value += Interval)
{
if (value >= range.Min && value <= range.Max)
{
string label = FormatTickLabel(value);
majorTicks.Add(new Tick(value, label, isMajor: true));
}
}
// 生成次刻度(如果有足够的空间)
List<Tick> minorTicks = new List<Tick>();
if (majorTicks.Count > 0 && majorTicks.Count < MaxTickCount - 10)
{
double minorInterval = Interval / 5.0;
double minorStart = Math.Ceiling(range.Min / minorInterval) * minorInterval;
for (double value = minorStart;
value <= range.Max && (majorTicks.Count + minorTicks.Count) < MaxTickCount;
value += minorInterval)
{
// 检查是否与主刻度重叠
bool isNearMajorTick = majorTicks.Any(t => Math.Abs(t.Position - value) < minorInterval * 0.1);
if (!isNearMajorTick && value >= range.Min && value <= range.Max)
{
minorTicks.Add(new Tick(value, string.Empty, isMajor: false));
}
}
}
// 合并并排序所有刻度
Ticks = majorTicks.Concat(minorTicks).OrderBy(t => t.Position).ToArray();
}
catch (Exception ex)
{
Console.WriteLine($"生成刻度时出错: {ex.Message}");
Ticks = Array.Empty<Tick>();
}
}
/// <summary>
/// 格式化刻度标签
/// </summary>
private string FormatTickLabel(double value)
{
// 处理接近零的值,避免显示 -0.00
if (Math.Abs(value) < Math.Pow(10, -Precision))
{
value = 0;
}
string formatted = value.ToString($"F{Precision}");
// 如果有单位,添加单位
if (!string.IsNullOrEmpty(Unit))
{
return $"{formatted} {Unit}";
}
return formatted;
}
}
/// <summary>
/// 安全区域温度轴配置器
/// </summary>
public class SafetyZoneTemperatureAxis
{
public static void Configure(Plot plot, double safeMin, double safeMax)
{
var tempAxis = plot.Axes.Left;
// 使用自定义刻度生成器
var tickGenerator = new IndustrialFixedIntervalTicks(10, "℃", 1);
tempAxis.TickGenerator = tickGenerator;
tempAxis.Label.Text = "炉温";
tempAxis.Label.FontSize = 14;
}
/// <summary>
/// 在数据添加后更新安全区域
/// </summary>
public static void UpdateSafetyZone(Plot plot, double safeMin, double safeMax)
{
try
{
// 移除现有的安全区域矩形
var existingRectangles = plot.GetPlottables<ScottPlot.Plottables.Rectangle>().ToList();
foreach (var rect in existingRectangles)
{
if (IsSafetyZoneRectangle(rect))
{
plot.Remove(rect);
}
}
// 获取当前X轴范围
var xRange = plot.Axes.Bottom.Range;
if (xRange.Span > 0)
{
// 添加新的安全区域
var safeZone = plot.Add.Rectangle(xRange.Min, safeMin, xRange.Span, safeMax - safeMin);
safeZone.FillStyle.Color = Colors.Green.WithAlpha(0.15);
safeZone.LineStyle.Width = 0;
// 将安全区域移到背景
plot.MoveToBack(safeZone);
}
}
catch (Exception ex)
{
Console.WriteLine($"更新安全区域时出错: {ex.Message}");
}
}
private static bool IsSafetyZoneRectangle(ScottPlot.Plottables.Rectangle rect)
{
try
{
var color = rect.FillStyle.Color;
return color.R == Colors.Green.R &&
color.G == Colors.Green.G &&
color.B == Colors.Green.B &&
color.A < 100;
}
catch
{
return false;
}
}
/// <summary>
/// 添加温度警告线和标签
/// </summary>
public static void AddWarningLines(Plot plot, double warningLow, double warningHigh, double alarmLow, double alarmHigh)
{
try
{
// 获取X轴位置用于标签
var xRange = plot.Axes.Bottom.Range;
var xPos = xRange.Min + xRange.Span * 0.02;
// 警告线(橙色虚线)
if (warningLow > 0)
{
var warningLineLow = plot.Add.HorizontalLine(warningLow);
warningLineLow.LineStyle.Color = Colors.Orange;
warningLineLow.LineStyle.Width = 2;
warningLineLow.LineStyle.Pattern = LinePattern.Dashed;
// 添加标签
var labelLow = plot.Add.Text($"警告 {warningLow}℃", xPos, warningLow);
labelLow.LabelAlignment = Alignment.MiddleLeft;
labelLow.LabelFontColor = Colors.Orange;
labelLow.LabelFontSize = 9;
labelLow.LabelBackgroundColor = Colors.White.WithAlpha(0.8);
}
if (warningHigh > 0)
{
var warningLineHigh = plot.Add.HorizontalLine(warningHigh);
warningLineHigh.LineStyle.Color = Colors.Orange;
warningLineHigh.LineStyle.Width = 2;
warningLineHigh.LineStyle.Pattern = LinePattern.Dashed;
// 添加标签
var labelHigh = plot.Add.Text($"警告 {warningHigh}℃", xPos, warningHigh);
labelHigh.LabelAlignment = Alignment.MiddleLeft;
labelHigh.LabelFontColor = Colors.Orange;
labelHigh.LabelFontSize = 9;
labelHigh.LabelBackgroundColor = Colors.White.WithAlpha(0.8);
}
// 报警线(红色实线)
if (alarmLow > 0)
{
var alarmLineLow = plot.Add.HorizontalLine(alarmLow);
alarmLineLow.LineStyle.Color = Colors.Red;
alarmLineLow.LineStyle.Width = 3;
// 添加标签
var labelLow = plot.Add.Text($"报警 {alarmLow}℃", xPos, alarmLow);
labelLow.LabelAlignment = Alignment.MiddleLeft;
labelLow.LabelFontColor = Colors.Red;
labelLow.LabelFontSize = 9;
labelLow.LabelBold = true;
labelLow.LabelBackgroundColor = Colors.White.WithAlpha(0.9);
}
if (alarmHigh > 0)
{
var alarmLineHigh = plot.Add.HorizontalLine(alarmHigh);
alarmLineHigh.LineStyle.Color = Colors.Red;
alarmLineHigh.LineStyle.Width = 3;
// 添加标签
var labelHigh = plot.Add.Text($"报警 {alarmHigh}℃", xPos, alarmHigh);
labelHigh.LabelAlignment = Alignment.MiddleLeft;
labelHigh.LabelFontColor = Colors.Red;
labelHigh.LabelFontSize = 9;
labelHigh.LabelBold = true;
labelHigh.LabelBackgroundColor = Colors.White.WithAlpha(0.9);
}
}
catch (Exception ex)
{
Console.WriteLine($"添加警告线时出错: {ex.Message}");
}
}
/// <summary>
/// 添加实时温度状态指示器(修正版)
/// </summary>
public static void AddTemperatureStatus(Plot plot, double currentTemp, double safeMin, double safeMax)
{
try
{
string status;
Color statusColor;
if (currentTemp >= safeMin && currentTemp <= safeMax)
{
status = "正常";
statusColor = Colors.Green;
}
else if (currentTemp < safeMin - 10 || currentTemp > safeMax + 10)
{
status = "报警";
statusColor = Colors.Red;
}
else
{
status = "警告";
statusColor = Colors.Orange;
}
var statusText = $"当前温度: {currentTemp:F1}℃ [{status}]";
// 方法1:使用坐标轴范围计算位置
var xRange = plot.Axes.Bottom.Range;
var yRange = plot.Axes.Left.Range;
double xPos = xRange.Min + xRange.Span * 0.02; // 左边2%位置
double yPos = yRange.Max - yRange.Span * 0.05; // 顶部5%位置
var statusLabel = plot.Add.Text(statusText, xPos, yPos);
statusLabel.LabelAlignment = Alignment.UpperLeft;
statusLabel.LabelFontColor = statusColor;
statusLabel.LabelFontSize = 12;
statusLabel.LabelBold = true;
statusLabel.LabelBackgroundColor = Colors.White.WithAlpha(0.9);
statusLabel.LabelBorderColor = statusColor;
statusLabel.LabelBorderWidth = 2;
statusLabel.LabelPadding = 8;
}
catch (Exception ex)
{
Console.WriteLine($"添加温度状态时出错: {ex.Message}");
}
}
/// <summary>
/// 添加温度统计信息面板
/// </summary>
public static void AddTemperatureStatsPanel(Plot plot, double[] temperatures)
{
if (temperatures == null || temperatures.Length == 0) return;
try
{
double avg = temperatures.Average();
double max = temperatures.Max();
double min = temperatures.Min();
double std = CalculateStandardDeviation(temperatures);
string statsText = $"温度统计信息:\n" +
$"• 平均值: {avg:F1}℃\n" +
$"• 最高值: {max:F1}℃\n" +
$"• 最低值: {min:F1}℃\n" +
$"• 标准差: {std:F2}℃\n" +
$"• 数据点: {temperatures.Length}";
// 计算右上角位置
var xRange = plot.Axes.Bottom.Range;
var yRange = plot.Axes.Left.Range;
double xPos = xRange.Max - xRange.Span * 0.02; // 右边2%位置
double yPos = yRange.Max - yRange.Span * 0.05; // 顶部5%位置
var statsLabel = plot.Add.Text(statsText, xPos, yPos);
statsLabel.LabelAlignment = Alignment.UpperRight;
statsLabel.LabelFontColor = Colors.Black;
statsLabel.LabelFontSize = 10;
statsLabel.LabelBackgroundColor = Colors.LightBlue.WithAlpha(0.9);
statsLabel.LabelBorderColor = Colors.Gray;
statsLabel.LabelBorderWidth = 1;
statsLabel.LabelPadding = 10;
}
catch (Exception ex)
{
Console.WriteLine($"添加统计面板时出错: {ex.Message}");
}
}
/// <summary>
/// 添加温度趋势指示器
/// </summary>
public static void AddTemperatureTrend(Plot plot, double[] temperatures)
{
if (temperatures == null || temperatures.Length < 10) return;
try
{
// 计算最近10个点的趋势
var recentTemps = temperatures.TakeLast(10).ToArray();
double trend = CalculateTrend(recentTemps);
string trendText;
Color trendColor;
if (Math.Abs(trend) < 0.1)
{
trendText = "→ 稳定";
trendColor = Colors.Gray;
}
else if (trend > 0)
{
trendText = $"↗ 上升 (+{trend:F2}℃/点)";
trendColor = Colors.Red;
}
else
{
trendText = $"↘ 下降 ({trend:F2}℃/点)";
trendColor = Colors.Blue;
}
// 计算中上方位置
var xRange = plot.Axes.Bottom.Range;
var yRange = plot.Axes.Left.Range;
double xPos = xRange.Min + xRange.Span * 0.5; // 中间位置
double yPos = yRange.Max - yRange.Span * 0.05; // 顶部5%位置
var trendLabel = plot.Add.Text(trendText, xPos, yPos);
trendLabel.LabelAlignment = Alignment.UpperCenter;
trendLabel.LabelFontColor = trendColor;
trendLabel.LabelFontSize = 11;
trendLabel.LabelBold = true;
trendLabel.LabelBackgroundColor = Colors.White.WithAlpha(0.9);
trendLabel.LabelBorderColor = trendColor;
trendLabel.LabelBorderWidth = 1;
trendLabel.LabelPadding = 6;
}
catch (Exception ex)
{
Console.WriteLine($"添加趋势指示器时出错: {ex.Message}");
}
}
private static double CalculateStandardDeviation(double[] values)
{
double mean = values.Average();
double sumOfSquares = values.Sum(v => Math.Pow(v - mean, 2));
return Math.Sqrt(sumOfSquares / values.Length);
}
private static double CalculateTrend(double[] values)
{
if (values.Length < 2) return 0;
// 简单线性回归计算斜率
double n = values.Length;
double sumX = 0, sumY = 0, sumXY = 0, sumXX = 0;
for (int i = 0; i < n; i++)
{
sumX += i;
sumY += values[i];
sumXY += i * values[i];
sumXX += i * i;
}
return (n * sumXY - sumX * sumY) / (n * sumXX - sumX * sumX);
}
}
}
踩坑预警:
Regenerate方法会被频繁调用! 用户每次缩放、平移都会触发。我之前在里面用了LINQ的复杂查询,结果拖动图表时CPU占用飙到80%。后来改成简单的for循环,问题解决。- 主次刻度的区分要通过
Tick的IsMajor属性控制,但ScottPlot 5的API在这块文档不全,我是翻源码才搞明白的。记得次刻度的label传空字符串。 - 单位换算要提前做好!别在生成器里临时换算(比如把mA转A),会导致精度问题和性能损耗。
💬 互动讨论
问题1: 你在项目中遇到过哪些"图表显示不专业"的尴尬时刻?欢迎评论区分享,说不定能帮到其他同学。
问题2: 对于实时数据流(每秒上千个数据点),你是怎么平衡"显示精度"和"渲染性能"的?我这边的方案是用数据抽稀+固定精度,但感觉还有优化空间。
实战挑战: 试试实现一个"压力-温度"双Y轴图表,左轴显示压力(MPa,精度0.01),右轴显示温度(℃,精度0.1),并确保两个轴的刻度数量一致(避免视觉混乱)。实现后欢迎在评论区贴代码!
🎯 三点总结与学习路径
回顾一下今天的核心内容:
核心收获:
- 精度控制三板斧: 简单场景用
Format属性(2分钟搞定),复杂需求上LabelFormatter(半小时),极致定制继承ITickGenerator(1-2天)。记住:优先用简单方案,别过度设计。 - 单位标注的工程化原则: 轴标题写全称+单位(如"反应釜温度 (℃)"),刻度标签可简化(直接显示数字)。除非客户明��要求,否则别在每个刻度上都加单位——太挤了。
- 性能优化的黄金法则: Formatter和Generator里禁止复杂计算,用空间换时间(提前算好单位换算表),实测保持渲染耗时<20ms就能保证流畅体验。
相关技术标签: #C#开发 #WPF #ScottPlot #数据可视化 #工业软件 #精度控制
📢 最后的碎碎念
写这篇文章的时候,我翻出了两年前监控项目的代码——当时为了搞定坐标轴精度问题,我愣是研究了三天ScottPlot 4的源码(那时候还没出5.0版本)。现在回头看,其实核心思路没变,变的是API更友好了,文档更完善了。
工业软件开发就是这样,细节决定成败。用户可能不懂你的算法多牛逼、架构多优雅,但他们能一眼看出"这图表是不是专业"。花点时间打磨这些细节,绝对值得。
如果这篇文章对你有帮助,不妨点个在看或转发给有需要的同事。遇到问题欢迎留言,我看到会回复(虽然可能不及时哈)。咱们下期见,争取写个ScottPlot性能优化的深度剖析!
🔖 收藏理由: 下次项目遇到图表精度问题,打开文章直接复制对应代码,改几个参数就能用,省下半天调试时间去摸鱼不香吗?


本文作者:技术老小子
本文链接:
版权声明:本博客所有文章除特别声明外,均采用 BY-NC-SA 许可协议。转载请注明出处!